Fig. 6.
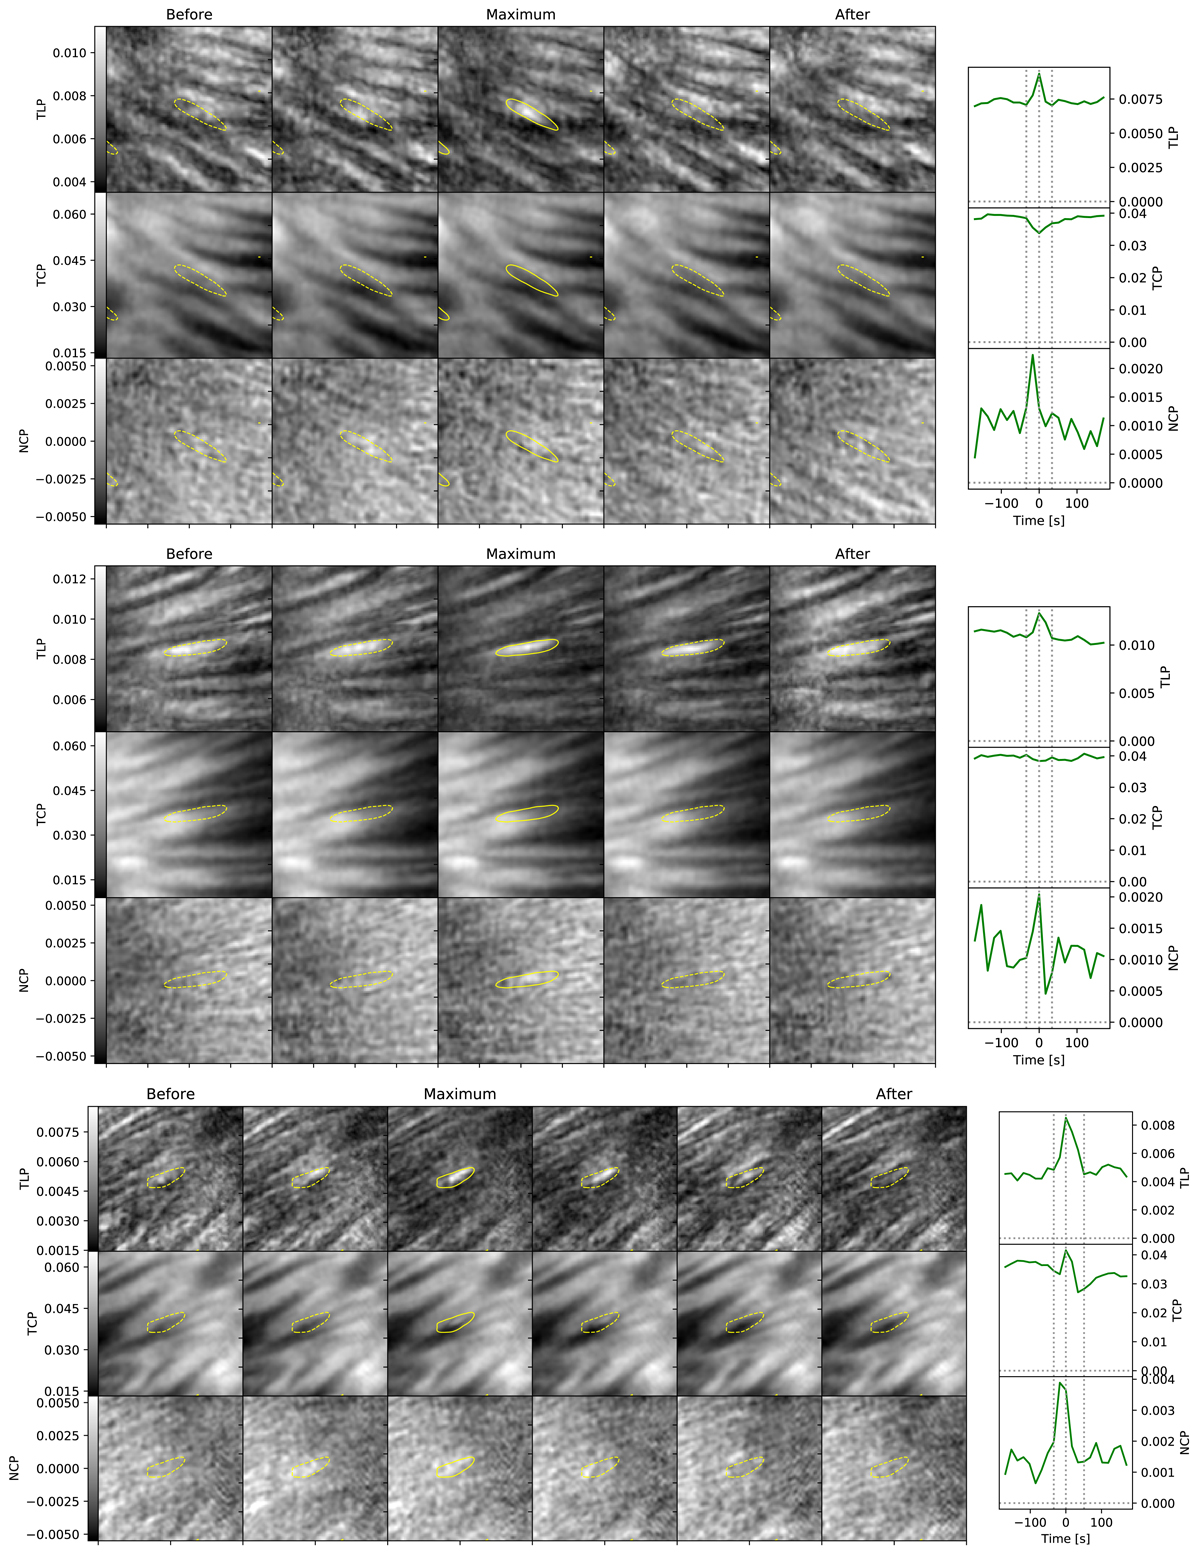
Temporal evolution of three PMJs whose positions within the penumbra are indicated in Fig. 1: PMJ 1 (top), PMJ 2 (middle), and PMJ 3 (bottom). Right: for each case the panels show, from top to bottom, maps of total linear polarization (TLP), total circular polarization (TCP), and net circular polarization (NCP). Contours enclose the PMJ area. Time runs from left to right with 17 s cadence. Left: evolution of the average TLP, TCP, and NCP in the microjet area. The vertical dotted lines correspond to the frames before, maximum, and after.
Current usage metrics show cumulative count of Article Views (full-text article views including HTML views, PDF and ePub downloads, according to the available data) and Abstracts Views on Vision4Press platform.
Data correspond to usage on the plateform after 2015. The current usage metrics is available 48-96 hours after online publication and is updated daily on week days.
Initial download of the metrics may take a while.