Fig. 3.
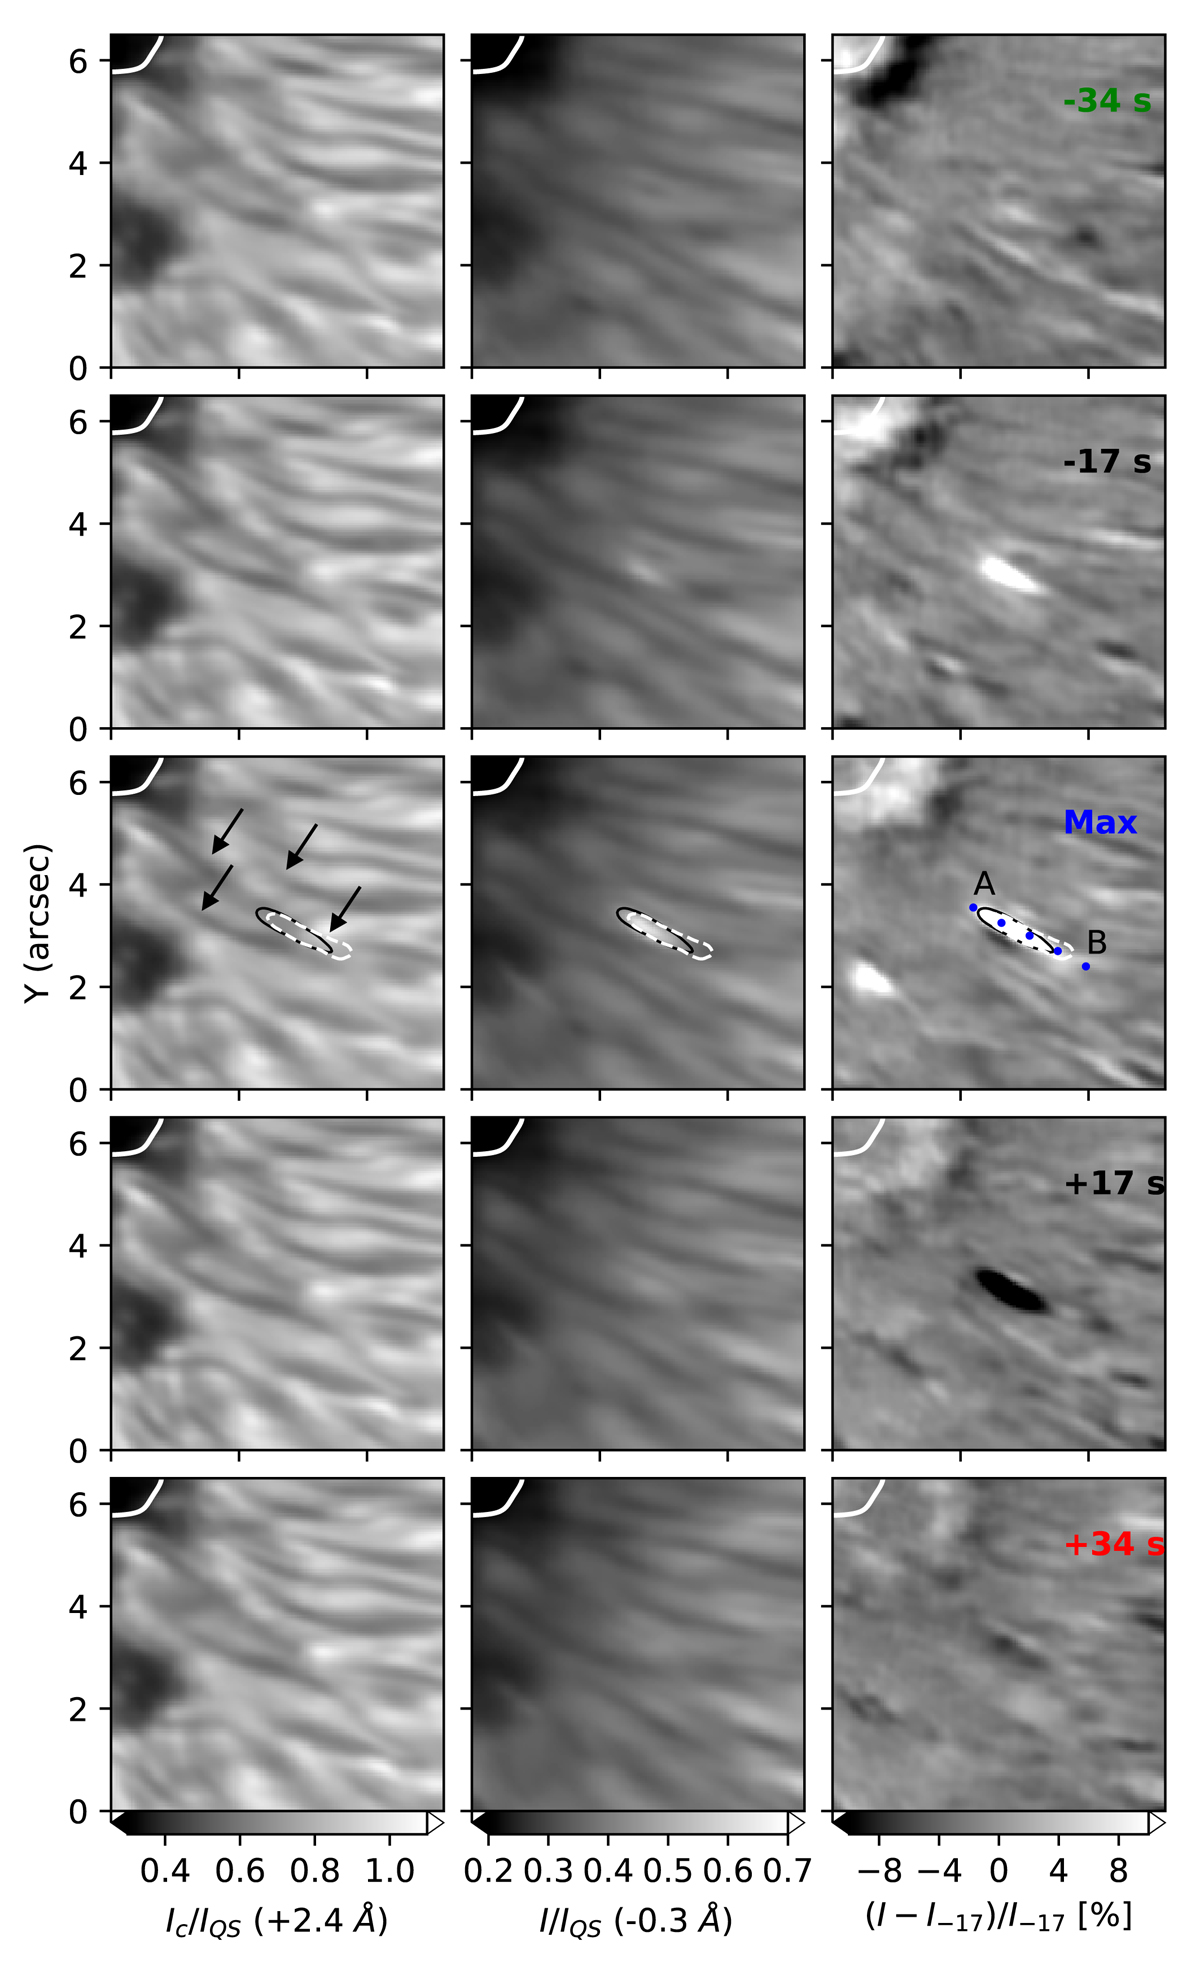
Example of the evolution of a PMJ whose brightening is observed during three frames (lifetime of 51 s) in the inner limb-side penumbra (labeled as PMJ 1 in Fig. 1). Left: continuum intensity images at +2.4 Å from the line core. Center: blue-wing images, at −0.3 Å from the core. Right: blue-wing intensity difference images with respect to the frame recorded 17 s before. Time increases from top to bottom, see labels on the right panels. Middle row: maximum brightness stage. Black contours delimit the PMJ area, that is, the region displaying blue-wing brightness enhancements larger than 10%. White dashed contours enclose the CC, defined as the region displaying a line-core brightness enhancement larger than 10%. White solid lines delimit the inner penumbral boundary. Black arrows indicate three penumbral filaments and a bright grain observed in the continuum images near the brightening region.
Current usage metrics show cumulative count of Article Views (full-text article views including HTML views, PDF and ePub downloads, according to the available data) and Abstracts Views on Vision4Press platform.
Data correspond to usage on the plateform after 2015. The current usage metrics is available 48-96 hours after online publication and is updated daily on week days.
Initial download of the metrics may take a while.