Free Access
Fig. 21.
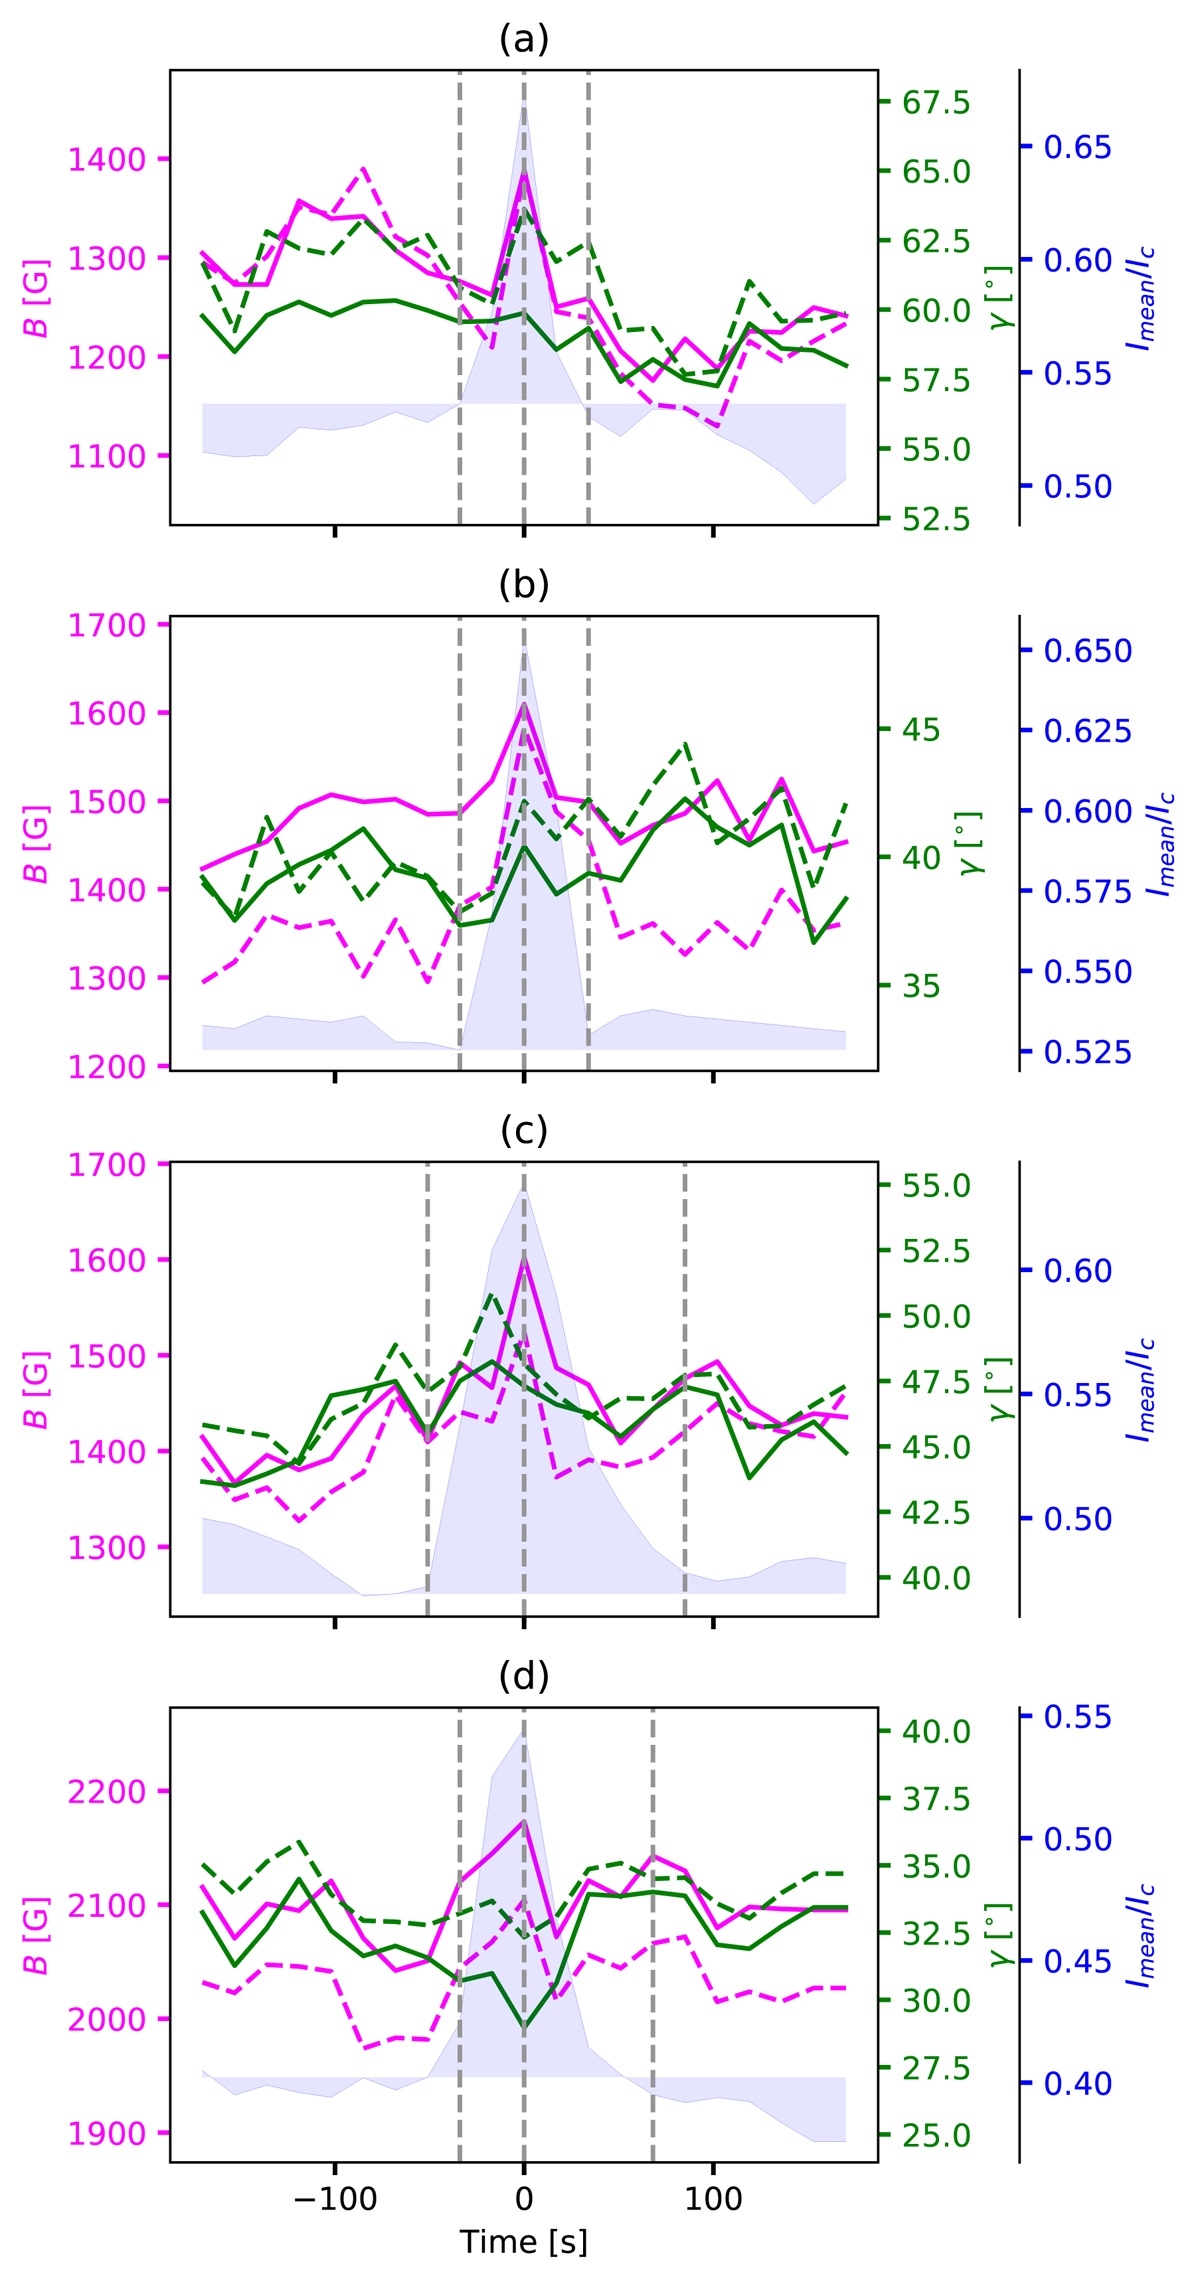
Temporal evolution of γ (green) and B (magenta) in the chromosphere as inferred from the WFA for the individual PMJs marked with crossed symbols in Fig. 2. The solid lines show the average values inside the PMJ regions and the dashed lines show averages inside the CC regions (same format as Fig. 19).
Current usage metrics show cumulative count of Article Views (full-text article views including HTML views, PDF and ePub downloads, according to the available data) and Abstracts Views on Vision4Press platform.
Data correspond to usage on the plateform after 2015. The current usage metrics is available 48-96 hours after online publication and is updated daily on week days.
Initial download of the metrics may take a while.