Fig. 2.
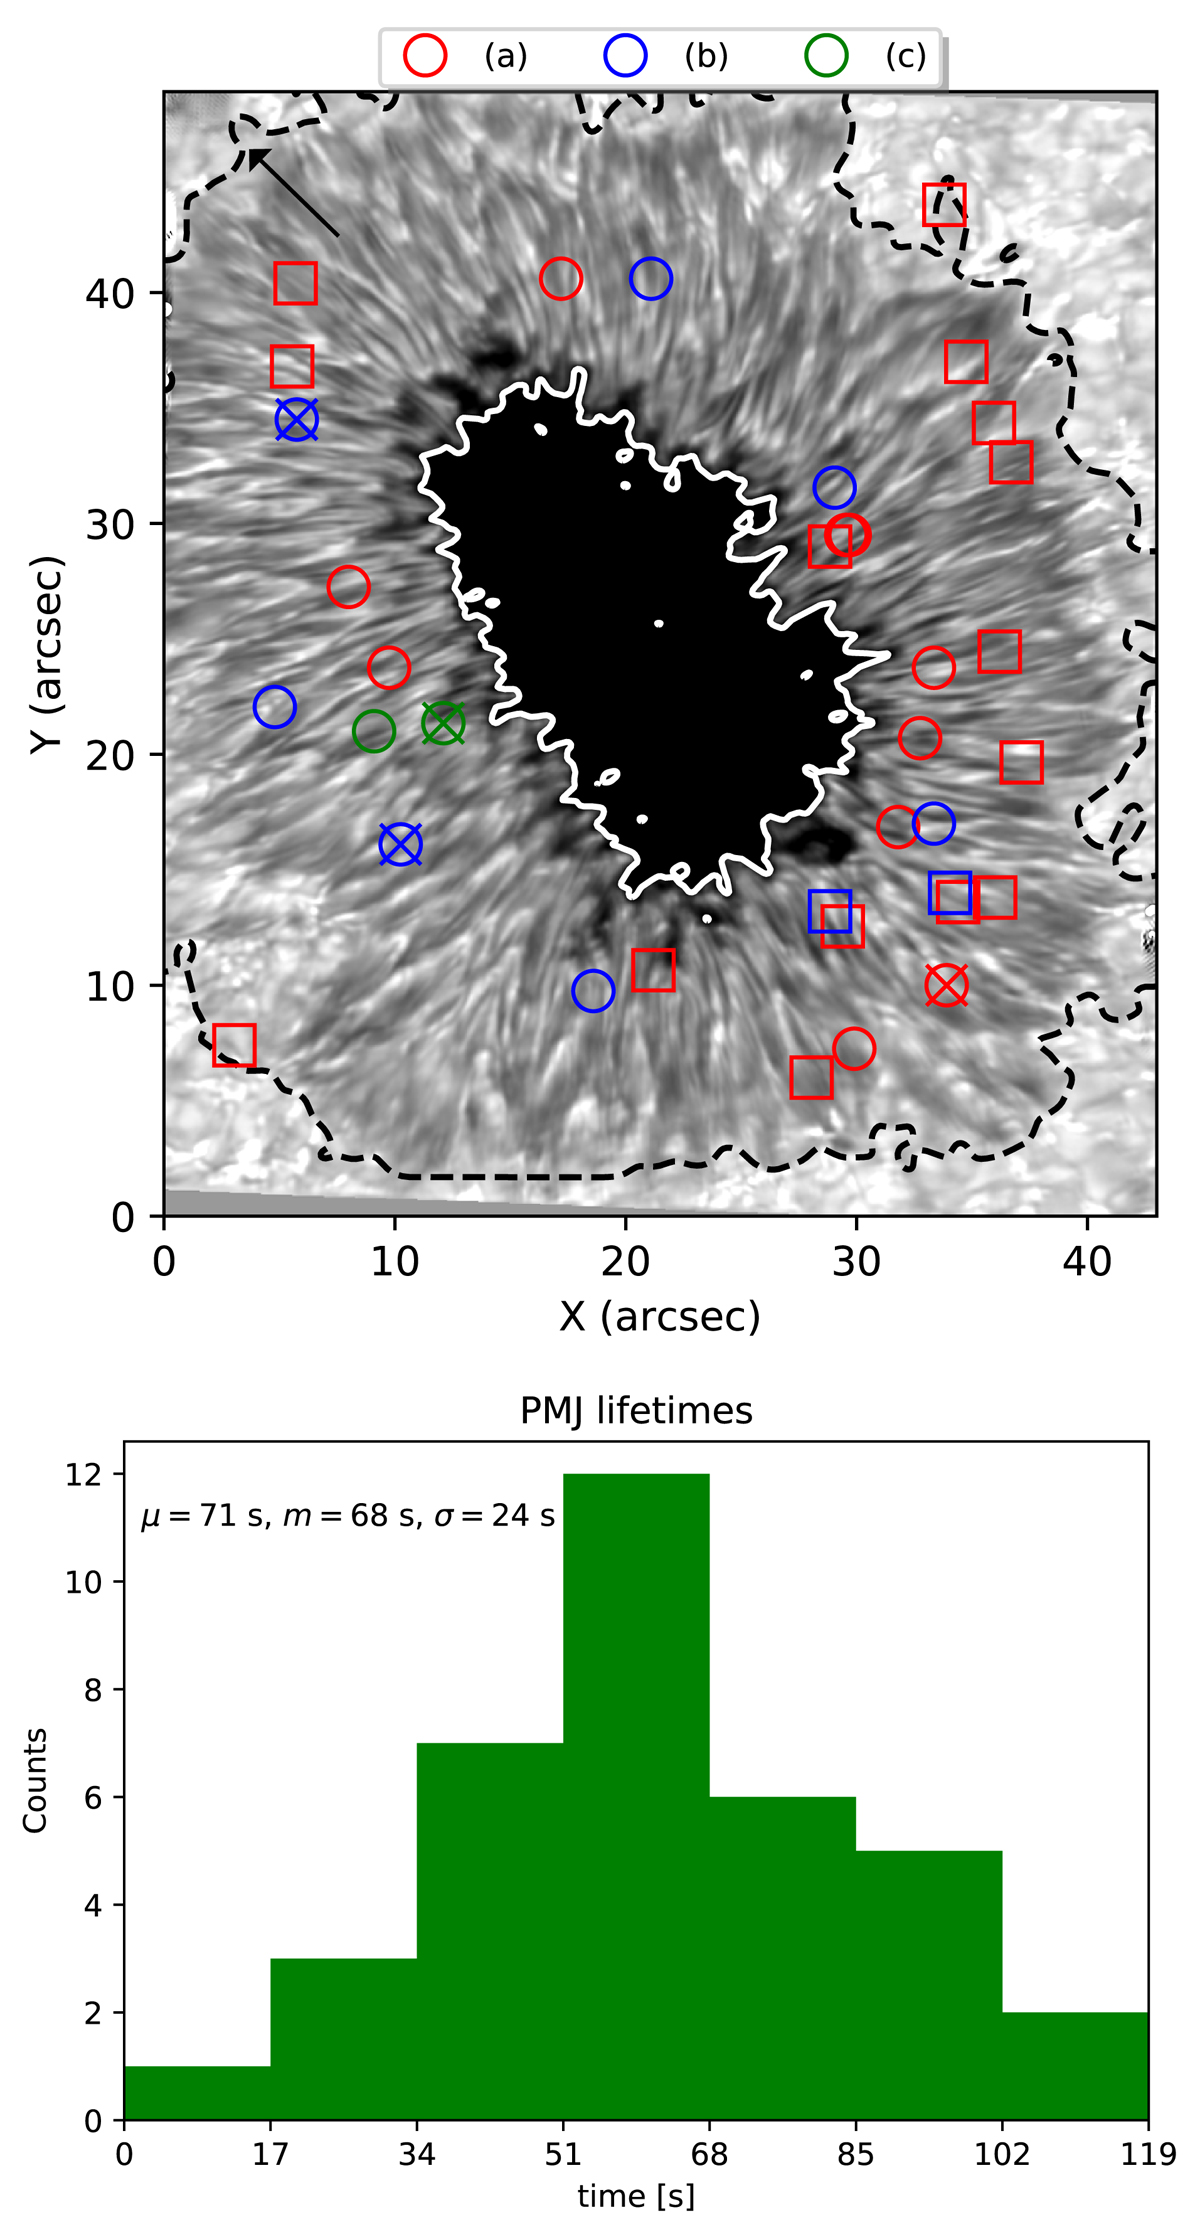
Top: continuum intensity image of the sunspot in the same format as Fig. 1, displaying the location of the 36 short-lived PMJs that were identified in the complete temporal sequence, with lifetimes shorter than 2 min. The different colors of the markers indicate different types of evolution of the photospheric magnetic field as described in the main text. PMJs displaying line core brightness enhancements larger than 10% are shown with circles; otherwise, they are indicated with squares. The crossed symbols stand for PMJs displaying clear changes of the chromospheric magnetic field during their brightening. Bottom: lifetime distribution for the selected PMJs. The mean μ, median m, and standard deviation σ of the distribution are indicated in the upper left corner.
Current usage metrics show cumulative count of Article Views (full-text article views including HTML views, PDF and ePub downloads, according to the available data) and Abstracts Views on Vision4Press platform.
Data correspond to usage on the plateform after 2015. The current usage metrics is available 48-96 hours after online publication and is updated daily on week days.
Initial download of the metrics may take a while.