Fig. 10.
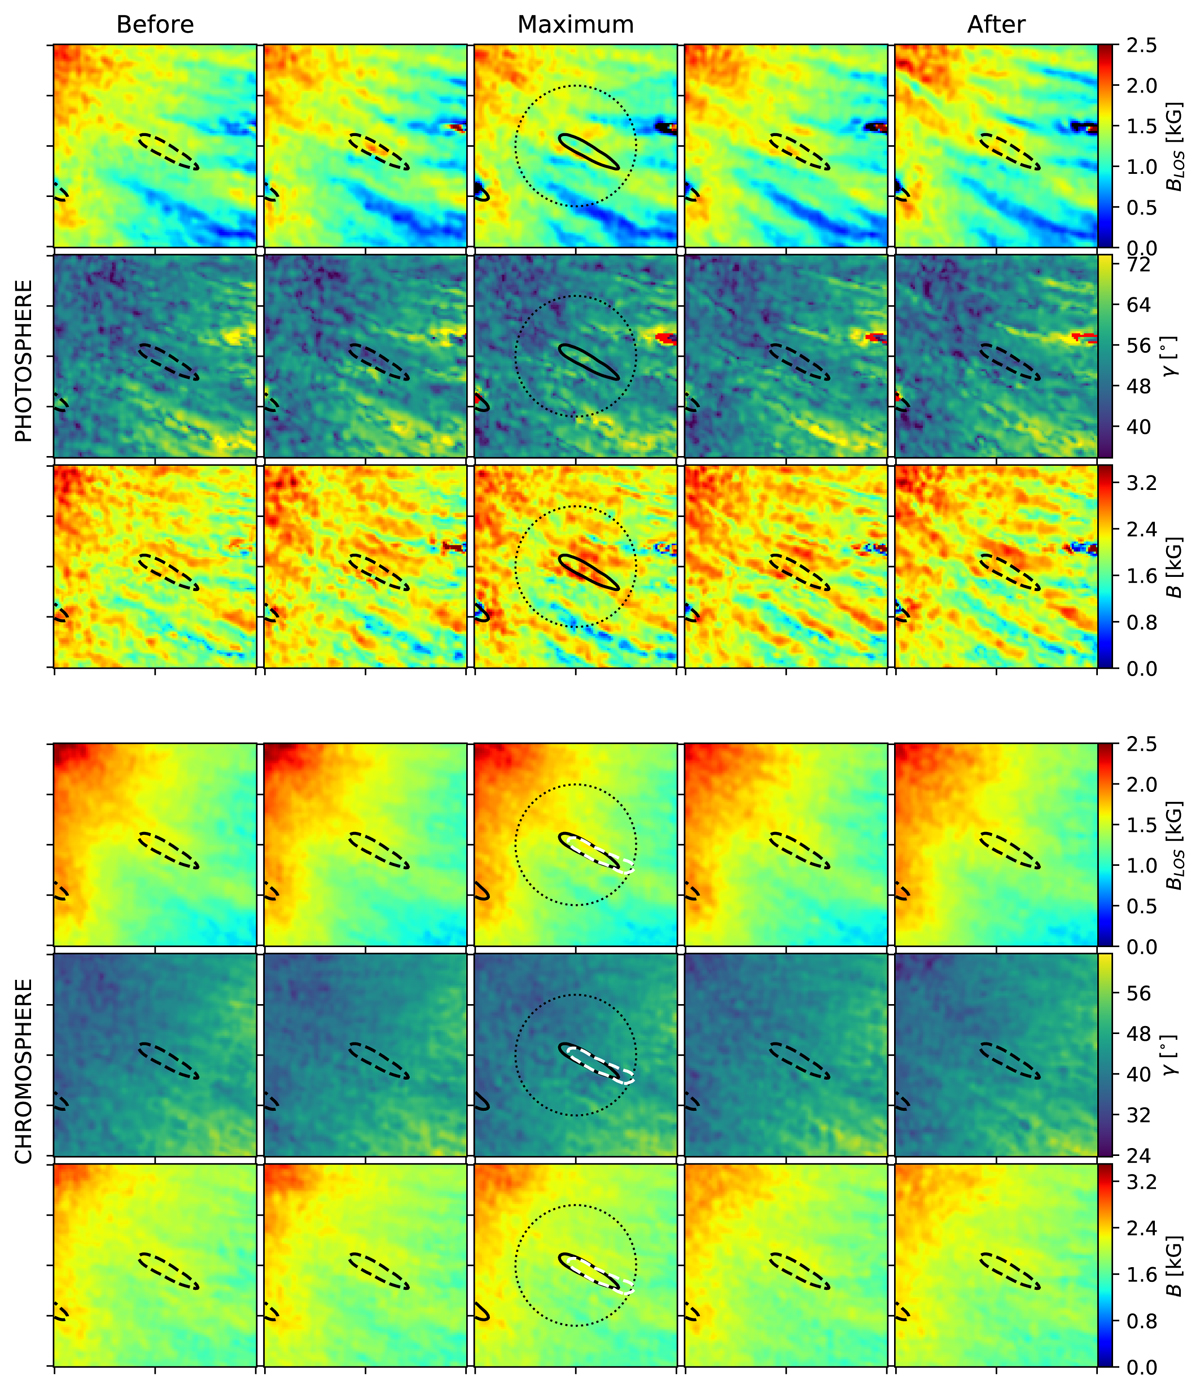
Maps of BLOS, γ, and B during the evolution of PMJ 1, computed by applying the WFA to the wings (first to third row) and to the line core (fourth to sixth row). The red patches in the inclination maps show regions where γ > 90°. The black contours enclose the PMJ area. Dotted circles on the maps at maximum define an arbitrarily chosen surrounding of the PMJ, centered on the MBP with a radius of 1.5″. The columns show consecutive frames separated by 17 s. The white contours enclose the CC region. The boxes cover a subfield of 5″ × 5″.
Current usage metrics show cumulative count of Article Views (full-text article views including HTML views, PDF and ePub downloads, according to the available data) and Abstracts Views on Vision4Press platform.
Data correspond to usage on the plateform after 2015. The current usage metrics is available 48-96 hours after online publication and is updated daily on week days.
Initial download of the metrics may take a while.