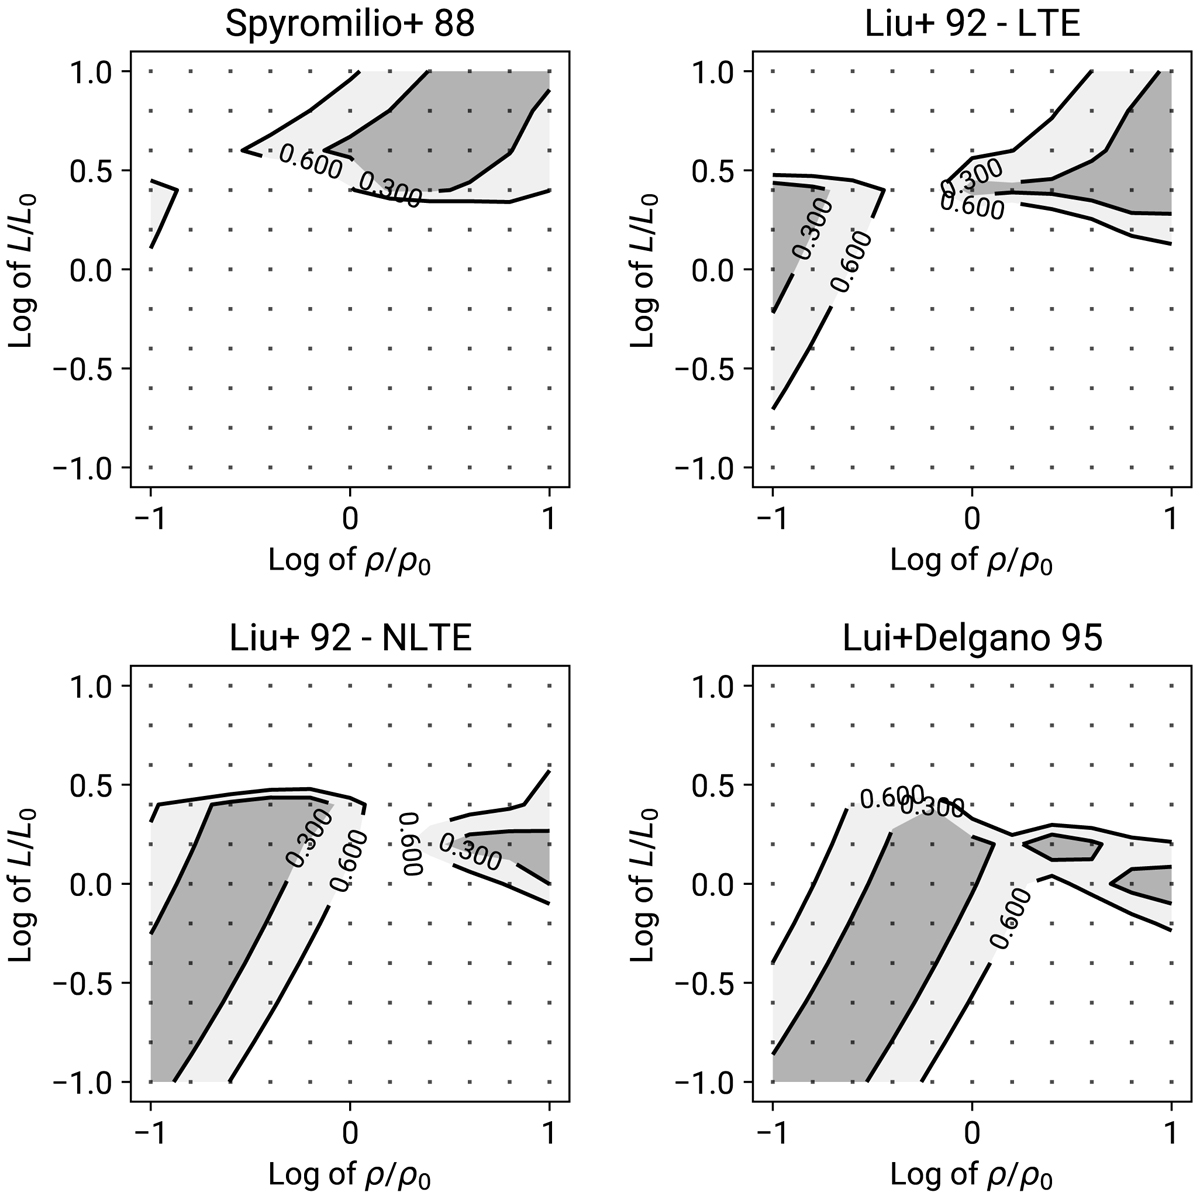
Fig. 8.

Differences between various observational estimates and the model result, over a grid of models with varying deposition energies and densities. The upper two plots compare to LTE CO mass estimates from Spyromilio et al. (1988) and Liu et al. (1992). The lower two plots are comparisons with NLTE CO estimates from Liu et al. (1992) and Liu & Dalgarno (1995). The dark grey shaded areas show the contours of 0.3 dex difference in CO mass and the light grey shaded areas show the 0.6 dex contours. ρ0 = 4.88 × 109 cm−3, and L0 = 6.2 × 1039 erg s−1 are the density and deposition energy for the standard SN 1987A model.
Current usage metrics show cumulative count of Article Views (full-text article views including HTML views, PDF and ePub downloads, according to the available data) and Abstracts Views on Vision4Press platform.
Data correspond to usage on the plateform after 2015. The current usage metrics is available 48-96 hours after online publication and is updated daily on week days.
Initial download of the metrics may take a while.


