Fig. 6.
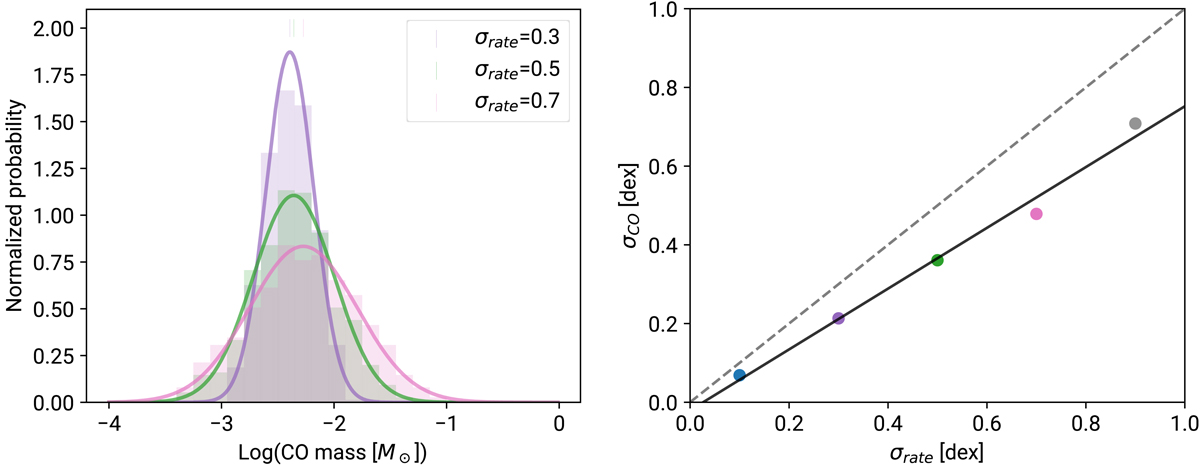
Left: CO mass distribution, for the MC tests with three different σrate. Right: σCO (standard deviation of the resulting CO distribution) against the σrate (standard deviation of the individual rates), for details see text. The solid black line is a fit to the data (slope = 0.8), the dashed line is the one-to-one relationship. For more details, see the text.
Current usage metrics show cumulative count of Article Views (full-text article views including HTML views, PDF and ePub downloads, according to the available data) and Abstracts Views on Vision4Press platform.
Data correspond to usage on the plateform after 2015. The current usage metrics is available 48-96 hours after online publication and is updated daily on week days.
Initial download of the metrics may take a while.