Fig. 2.
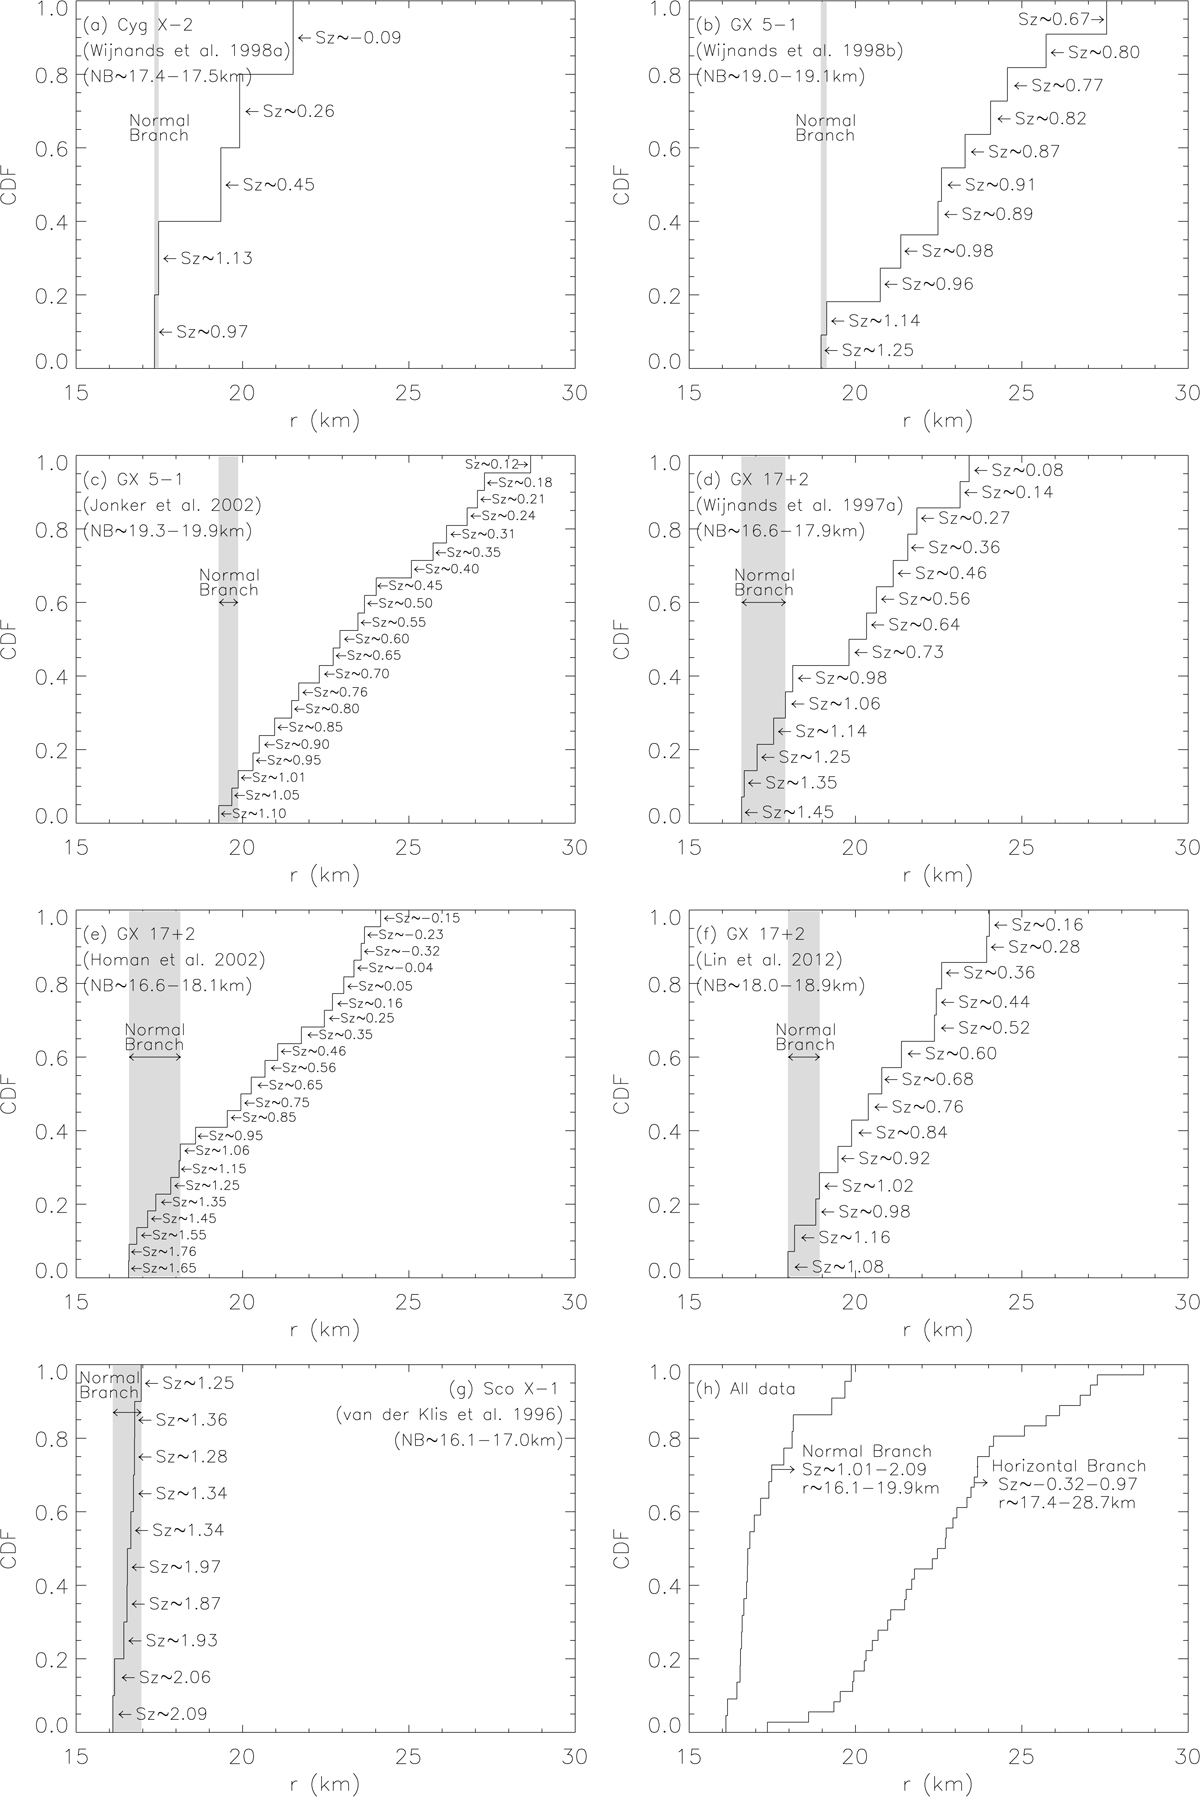
Cumulative distribution function curves of the kHz QPO emission radius r, as well as the corresponding Sz values, for (a) Cyg X-2 (Sz ∼ − 0.09−1.13, r ∼ 17.4−21.5 km), (b) GX 5-1 (Sz ∼ 0.67−1.25, r ∼19.0−27.6 km), (c) GX 5-1 (Sz ∼ 0.12−1.10, r ∼ 19.3− 28.7 km), (d) GX 17+2 (Sz ∼ 0.08−1.45, r ∼ 16.6− 23.4 km), (e) GX 17+2 (Sz ∼ − 0.32−1.76, r ∼ 16.6−24.1 km), (f) GX 17+2 (Sz ∼ 0.16−1.16, r ∼ 18.0−24.0 km), and (g) Sco X-1 (Sz ∼ 1.25−2.09, r ∼ 16.1−17.0 km). The ranges of r that correspond to NB (Sz ∼ 1−2) are indicated in the shaded areas. (h) The CDF curves of all the kHz QPO emission radii that correspond to the HB (Sz ∼ − 0.32−0.97, r ∼ 17.4−28.7 km) and corresponds to the NB (Sz ∼ 1.01−2.09, r ∼ 16.1−19.9 km) by combining the r values in diagram (a) (Cyg X-2), (c) (GX 5-1), (e) (GX 17+2), and (g) (Sco X-1).
Current usage metrics show cumulative count of Article Views (full-text article views including HTML views, PDF and ePub downloads, according to the available data) and Abstracts Views on Vision4Press platform.
Data correspond to usage on the plateform after 2015. The current usage metrics is available 48-96 hours after online publication and is updated daily on week days.
Initial download of the metrics may take a while.