Fig. 1.
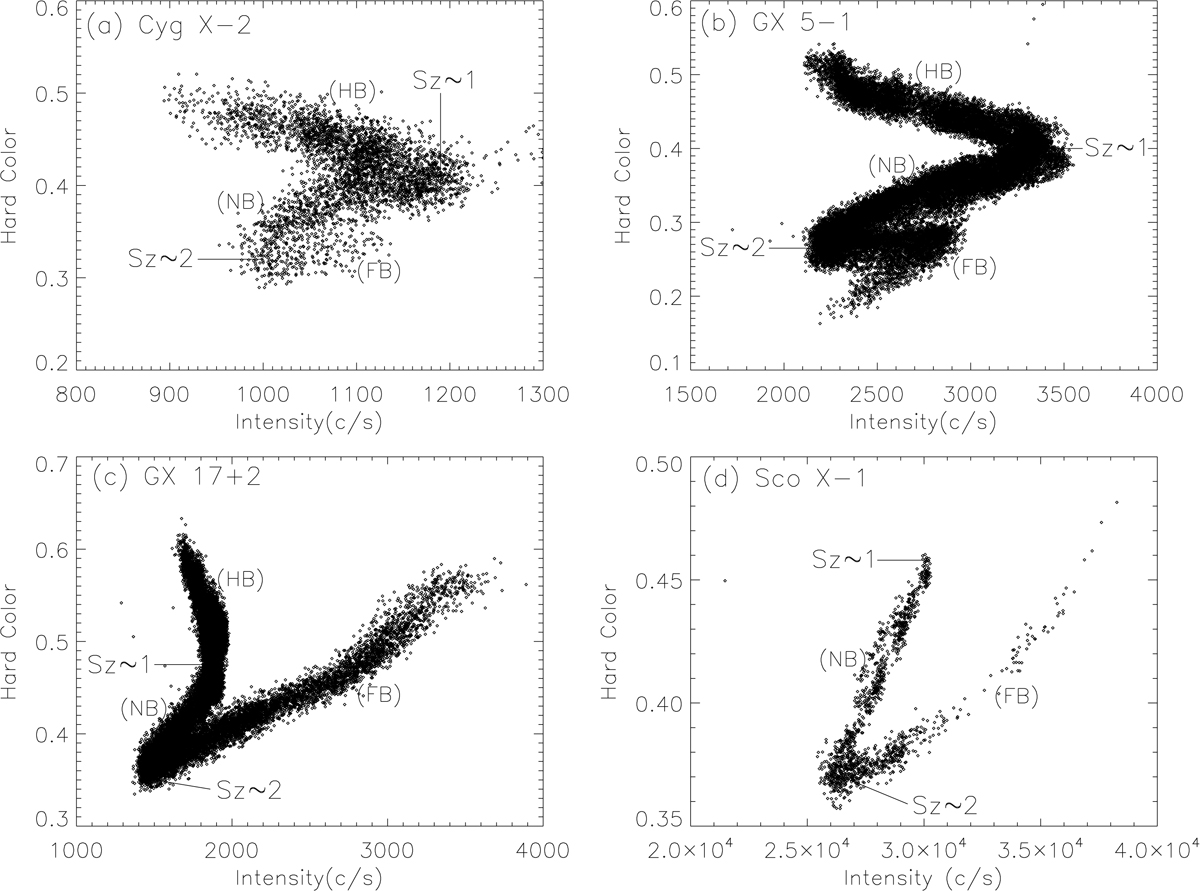
Schematic diagrams of the Z tracks in the hardness-intensity diagrams, for (a) Cyg X-2, (b) GX 5-1, (c) GX 17+2, and (d) Sco X-1, where the approximate positions of the HB/NB vertex (Sz ∼ 1) and NB/FB vertex (Sz ∼ 2) are indicated by the parameter Sz as defined by Hasinger et al. (1990) and Wijnands et al. (1997b) (see the text). On the axis quantities of the diagrams, the hard colors are defined as the ratio of the count rate in the bands of 9.8−15.9 keV/6.5−9.8 keV for Cyg X-2, GX 5-1, and GX 17+2, and 9.8−15.9 keV/6.4−9.8 keV for Sco X-1, while the X-ray intensities are defined as the count rate in 1.9−15.9 keV for Cyg X-2, GX 5-1, GX 17, and 2.0−15.9 keV for Sco X-1. The diagrams are produced with the same RXTE data as that in Wijnands et al. (1998a) for Cyg X-2, Jonker et al. (2002) for GX 5-1, Homan et al. (2002) for GX 17+2, and van der Klis et al. (1996) for Sco X-1. The hard colors are not dead-time corrected because of the small correction factors (< 0.2%).
Current usage metrics show cumulative count of Article Views (full-text article views including HTML views, PDF and ePub downloads, according to the available data) and Abstracts Views on Vision4Press platform.
Data correspond to usage on the plateform after 2015. The current usage metrics is available 48-96 hours after online publication and is updated daily on week days.
Initial download of the metrics may take a while.