Fig. 8.
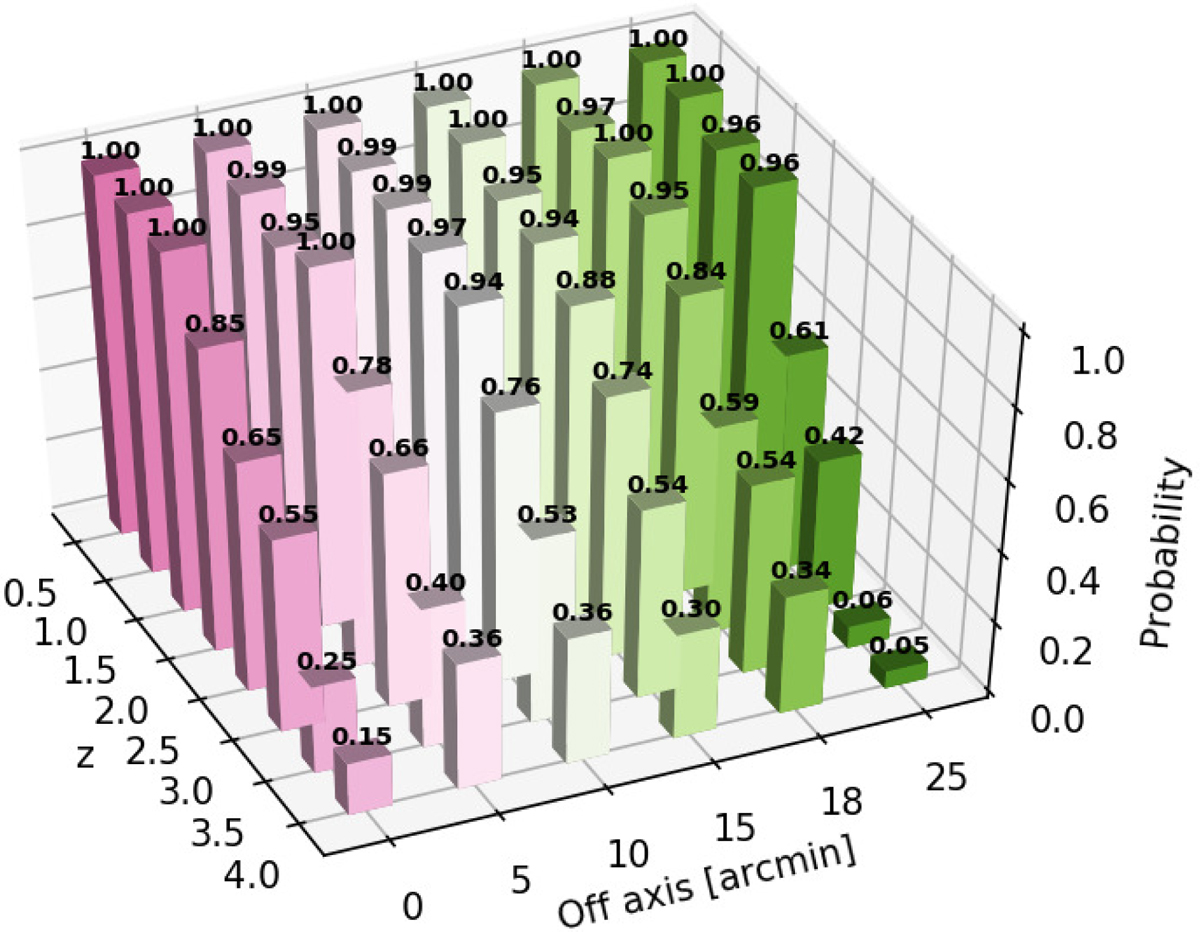
Three-dimensional detection probability of 5 × 10¹³ M⊙ galaxy groups with 80 ks exposure time. The x- and y-axes indicate the redshift (z) and off-axis angle [arcmin], respectively. The z-axis represents the detection probability. A detection probability equal to one means that all simulated galaxy groups are detected as extended sources.
Current usage metrics show cumulative count of Article Views (full-text article views including HTML views, PDF and ePub downloads, according to the available data) and Abstracts Views on Vision4Press platform.
Data correspond to usage on the plateform after 2015. The current usage metrics is available 48-96 hours after online publication and is updated daily on week days.
Initial download of the metrics may take a while.