Fig. 4.
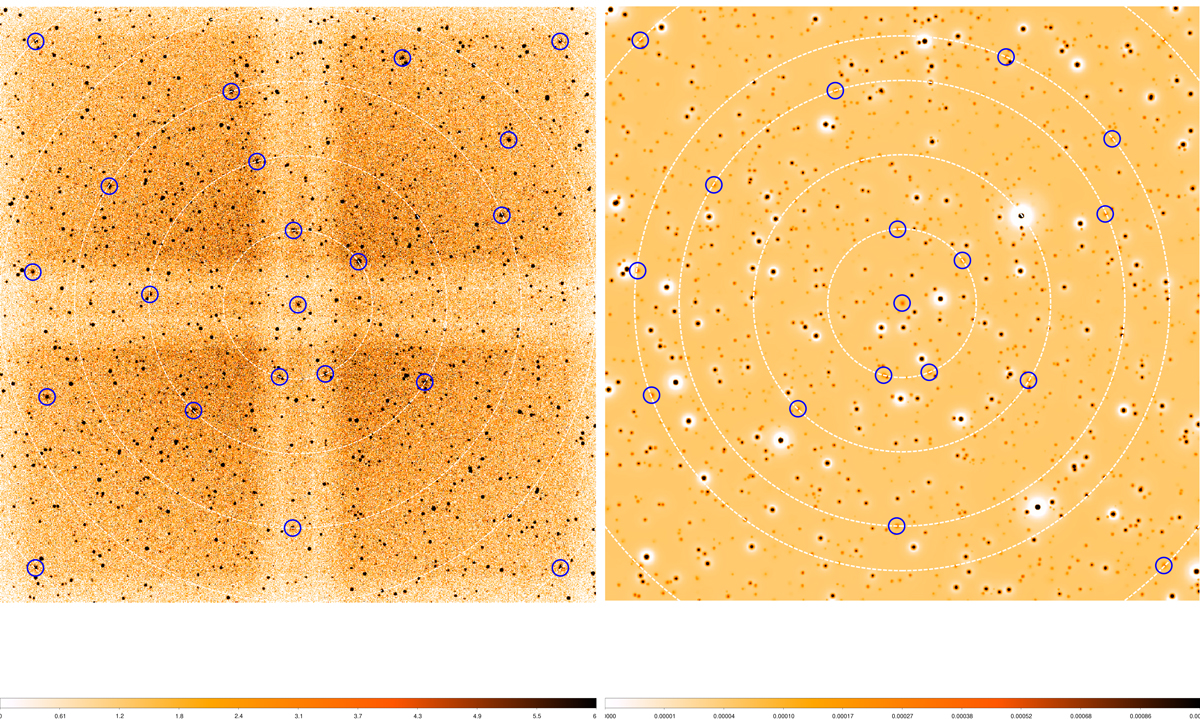
Left: example of the SIXTE simulated image of an 80 ks ATHENA/WFI observation. Cosmic X-ray background, Galactic foreground, and particle background are included as well as telescope vignetting and PSF degradation with an off-axis angle. The blue circles on the left correspond to the size of r500 of the input groups, which are located at z = 2.0 with M500 = 5 × 10¹³ M⊙. Right: wavelet image of this SIXTE simulated image. The blue circles represent the detected sources after SEXTRACTOR and the maximum likelihood fitting detection algorithm are run; three sources are undetected by our algorithm.
Current usage metrics show cumulative count of Article Views (full-text article views including HTML views, PDF and ePub downloads, according to the available data) and Abstracts Views on Vision4Press platform.
Data correspond to usage on the plateform after 2015. The current usage metrics is available 48-96 hours after online publication and is updated daily on week days.
Initial download of the metrics may take a while.