Fig. 4
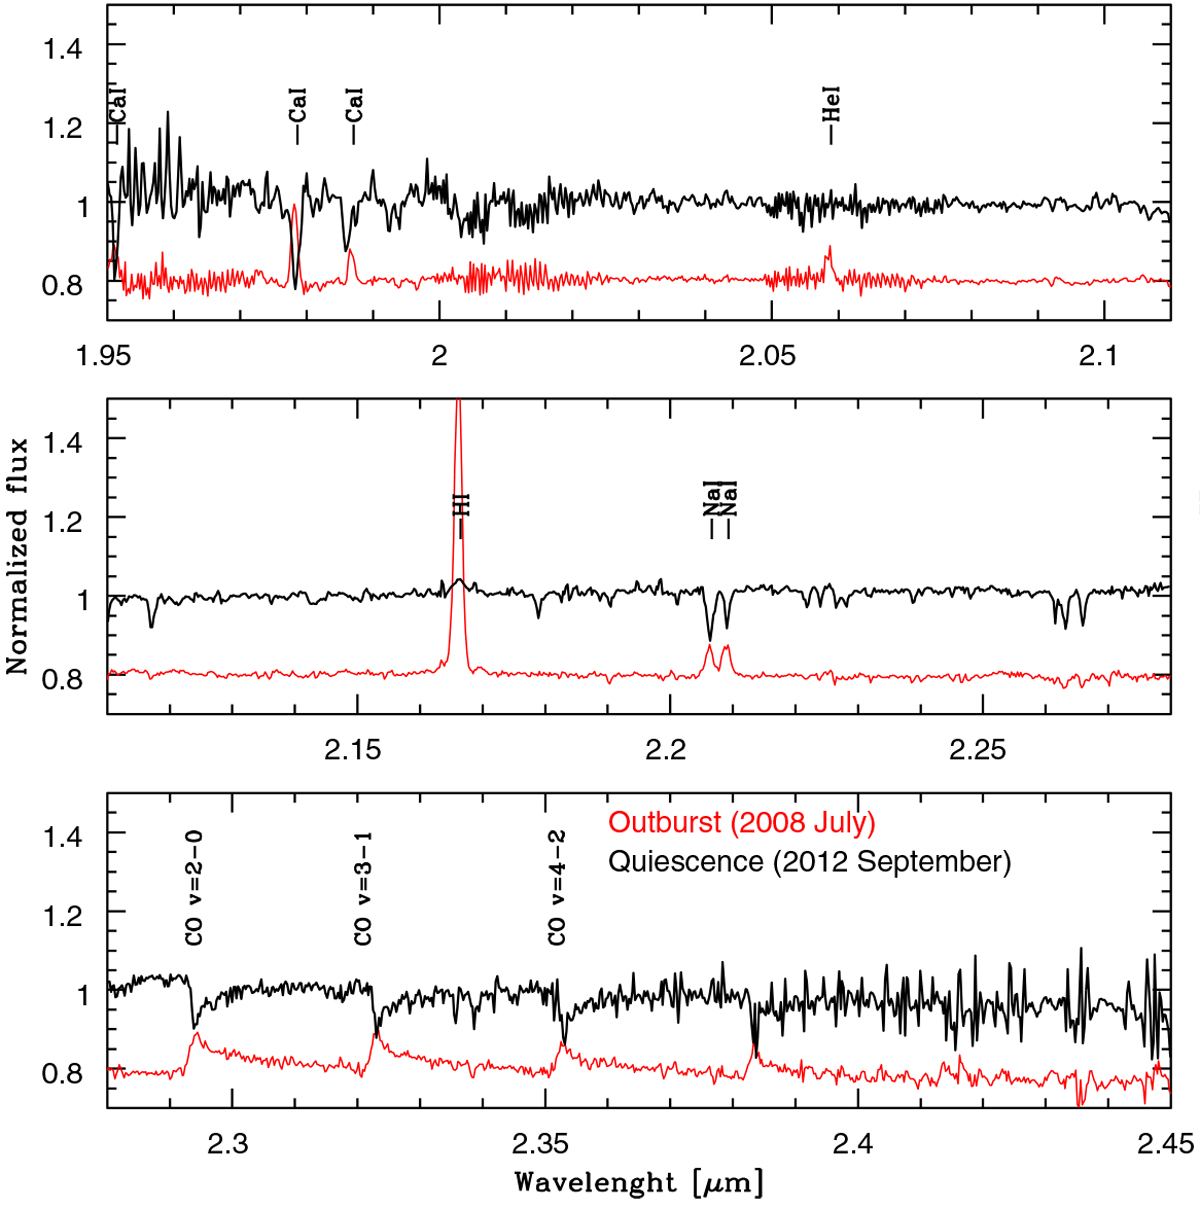
Normalized SINFONI K-band spectrum of EX Lup in quiescence compared to the outburst. The position of the emission lines seen in the K-band spectrum taken during the outburst are marked (Kóspál et al. 2011). All the lines are seen in absorption rather than in emission. The CO overtone bandhead are also seen in absorption. The outburst spectrum is shifted in intensity.
Current usage metrics show cumulative count of Article Views (full-text article views including HTML views, PDF and ePub downloads, according to the available data) and Abstracts Views on Vision4Press platform.
Data correspond to usage on the plateform after 2015. The current usage metrics is available 48-96 hours after online publication and is updated daily on week days.
Initial download of the metrics may take a while.