Fig. 19
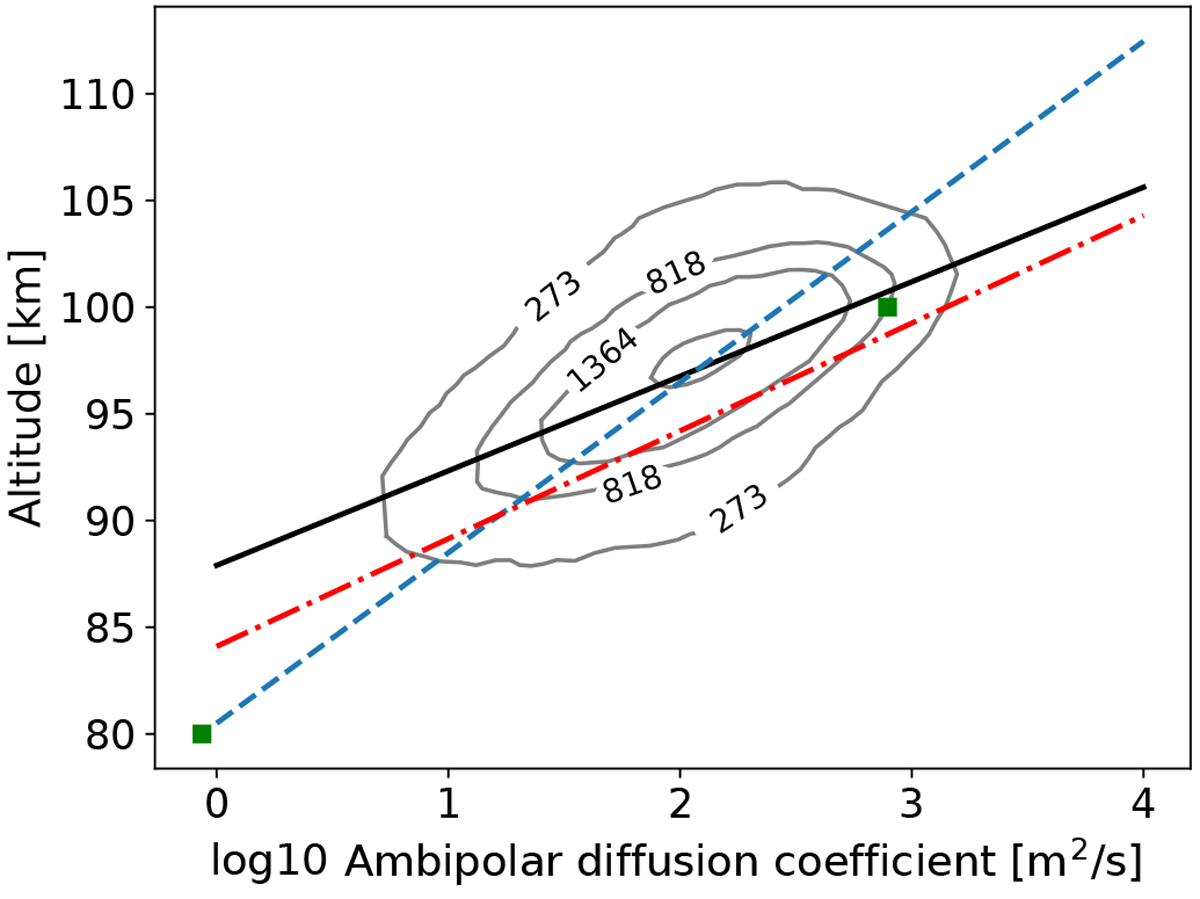
Base-10 logarithm of the ambipolar diffusion coefficient in function of the altitude. Comparison between numerical simulations from present work (marker ![]() ) and fits to observed radio signal decays: Greenhow & Hall (1961) (dashed blue line), Jones & Jones (1990) (dashed red line), Galligan et al. (2004) (solid black line). Contour lines from the AMOR data correspond to the number of detections.
) and fits to observed radio signal decays: Greenhow & Hall (1961) (dashed blue line), Jones & Jones (1990) (dashed red line), Galligan et al. (2004) (solid black line). Contour lines from the AMOR data correspond to the number of detections.
Current usage metrics show cumulative count of Article Views (full-text article views including HTML views, PDF and ePub downloads, according to the available data) and Abstracts Views on Vision4Press platform.
Data correspond to usage on the plateform after 2015. The current usage metrics is available 48-96 hours after online publication and is updated daily on week days.
Initial download of the metrics may take a while.