Fig. 10
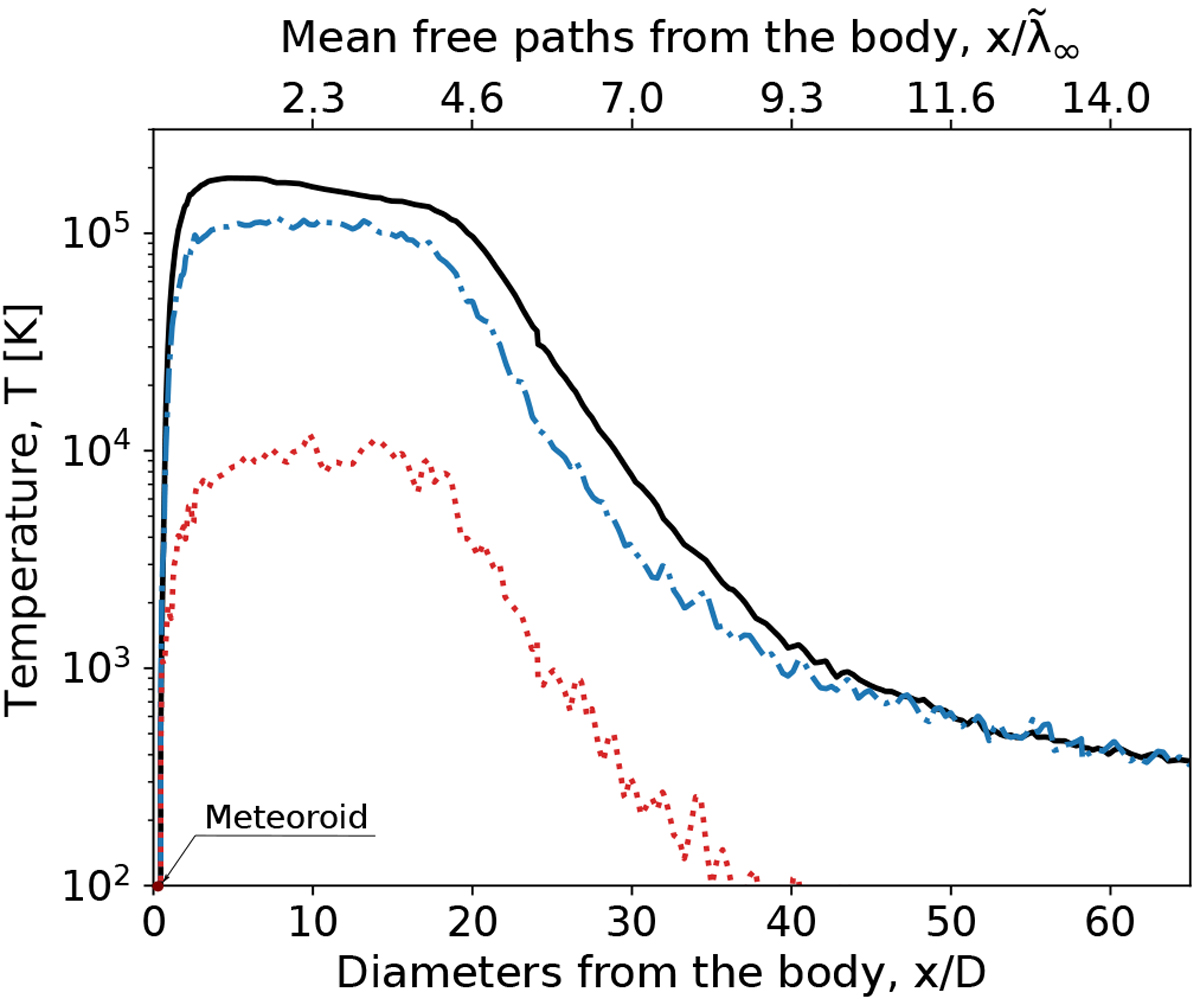
Translational and internal temperature profiles along the near trail at 80 km altitude. The reference system is centred at the stagnation point. In the near trail, Ttr (solid black line) and Trot (dashed blue line) take only a few microseconds (around 10 mean free paths) to relax to the values of the freestream. Vibrational temperature is marked with a dotted red line.
Current usage metrics show cumulative count of Article Views (full-text article views including HTML views, PDF and ePub downloads, according to the available data) and Abstracts Views on Vision4Press platform.
Data correspond to usage on the plateform after 2015. The current usage metrics is available 48-96 hours after online publication and is updated daily on week days.
Initial download of the metrics may take a while.