Fig. 1
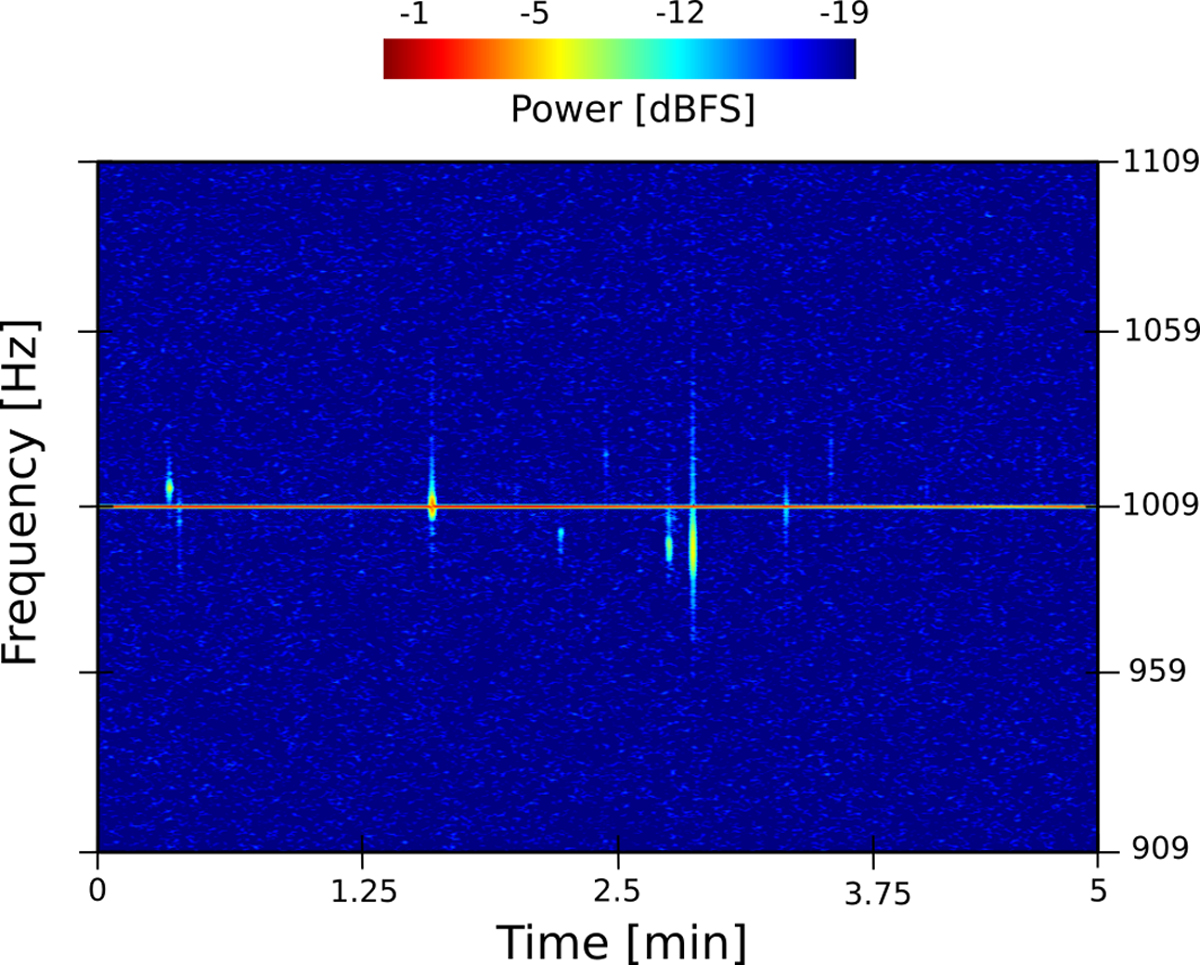
Example of a BRAMS spectrogram recorded for 5 min after processing the signal. The spectrogram displays how the power of the signal is distributed among the frequencies as a function of time. The horizontal line is the direct tropospheric beacon coming from the transmitter. All the vertical traces (we can count up to nine in this plot) are underdense meteor echoes. We give credit to the Royal Belgian Institute for Space Aeronomy.
Current usage metrics show cumulative count of Article Views (full-text article views including HTML views, PDF and ePub downloads, according to the available data) and Abstracts Views on Vision4Press platform.
Data correspond to usage on the plateform after 2015. The current usage metrics is available 48-96 hours after online publication and is updated daily on week days.
Initial download of the metrics may take a while.