Fig. 8.
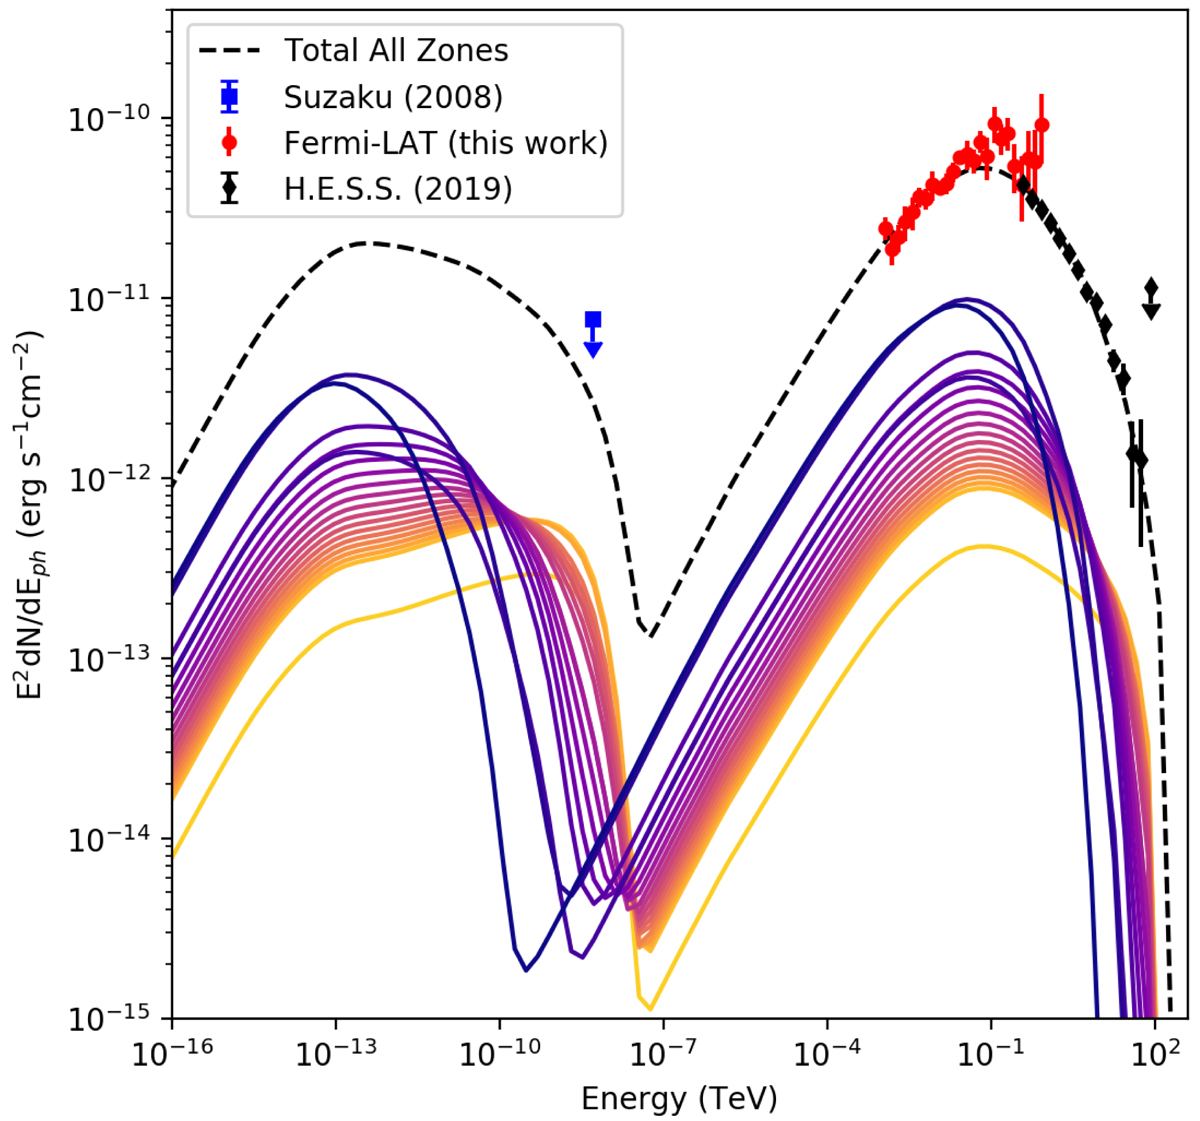
Total SED of the nebula, combining X-ray and γ-ray data, is described by the summation of 20 zones of particles of different ages using the GAMERA modelling package Hahn (2016). The total SED of each zone is shown by a coloured line, from yellow for the youngest and smallest zone, through to blue for the oldest and largest. Model parameters are given in Table 6.
Current usage metrics show cumulative count of Article Views (full-text article views including HTML views, PDF and ePub downloads, according to the available data) and Abstracts Views on Vision4Press platform.
Data correspond to usage on the plateform after 2015. The current usage metrics is available 48-96 hours after online publication and is updated daily on week days.
Initial download of the metrics may take a while.