Fig. 4.
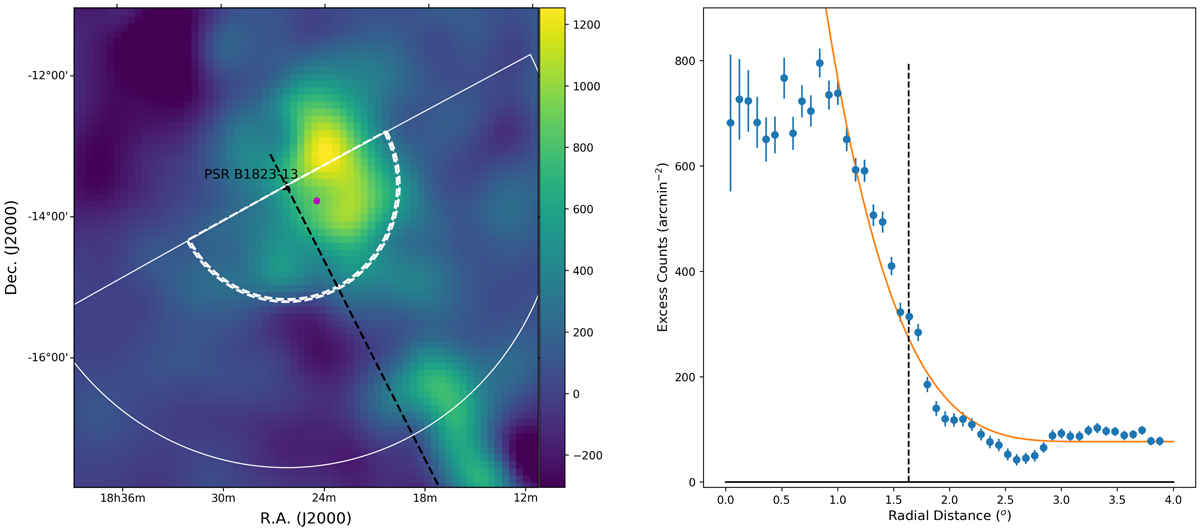
Left: TS map (in counts) of the PWN HESS J1825-137 in the energy range 1 GeV–1 TeV with Fermi-LAT, with the region used to extract the radial profile (as used by H.E.S.S.) overlaid in white. The preferred emission direction (“major axis”) as found by H.E.S.S., along which the extent is evaluated, is indicated by the black dashed line. The position of the pulsar (black) and best-fit Fermi-LAT centre of a 2D Gaussian (magenta) are also indicated. Right: radial profile of the excess counts fit with Eq. (3) beyond the peak emission. The characteristic R(1/e) size of the nebula is indicated by a white (black) dashed line in the left (right) hand plot.
Current usage metrics show cumulative count of Article Views (full-text article views including HTML views, PDF and ePub downloads, according to the available data) and Abstracts Views on Vision4Press platform.
Data correspond to usage on the plateform after 2015. The current usage metrics is available 48-96 hours after online publication and is updated daily on week days.
Initial download of the metrics may take a while.