Fig. A.1.
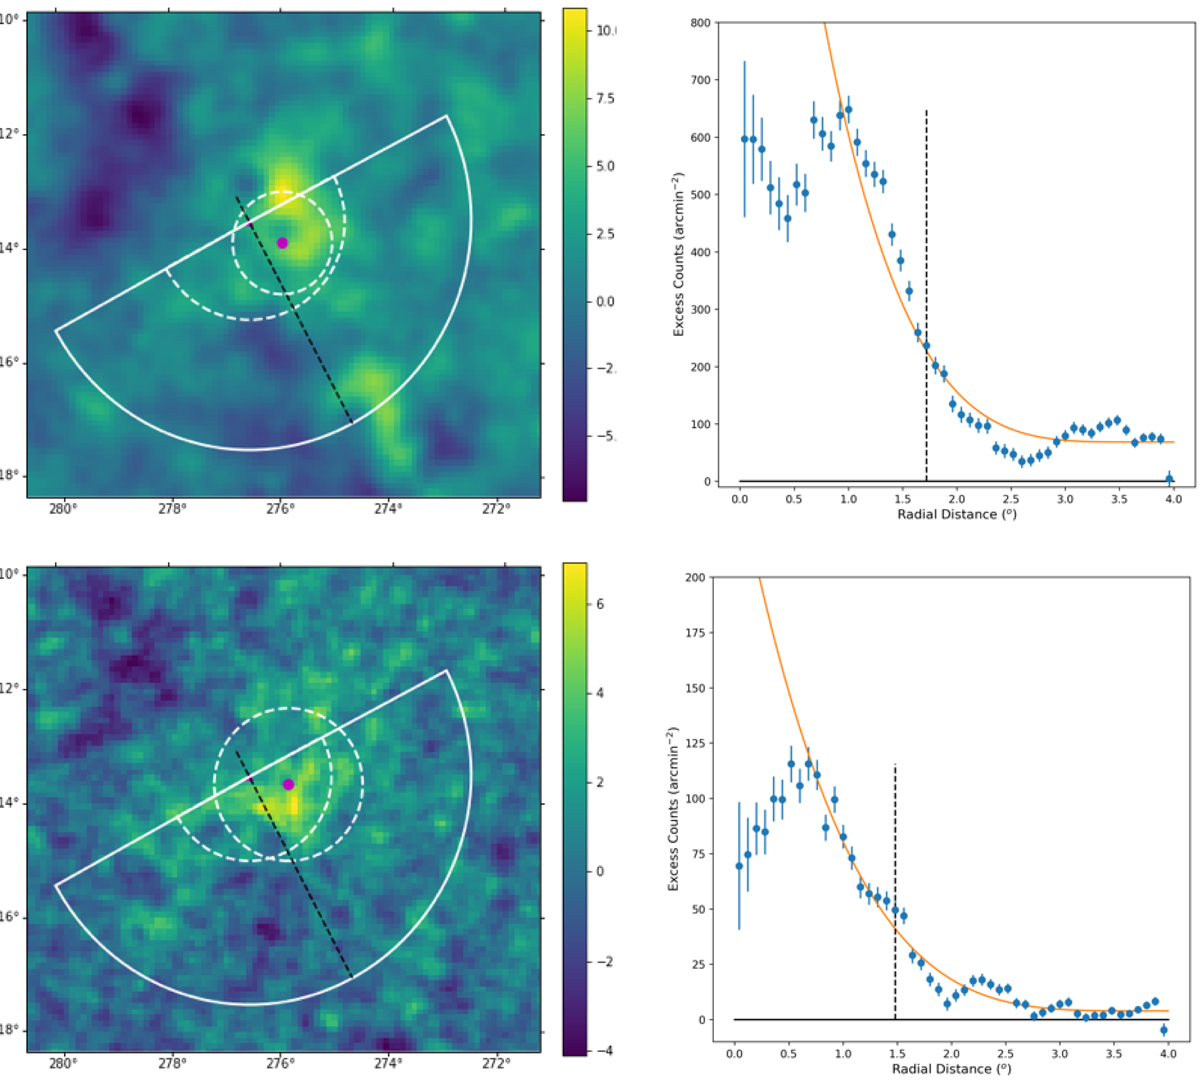
Left: excess maps (in sigma units), in celestial coordinates, of the region around HESS J1825-137. The magenta points and the white dashed circles represent the 2D-Gaussian centroid and extension respectively, while the dashed semicircumference shows the extension obtained with the radial profile method considering only the southern hemisphere. For comparison, the region used to extract the radial profile (as used by H.E.S.S.) is overlaid in white. The preferred emission direction (major axis) as found by H.E.S.S., along which the extent is evaluated, is indicated by the black dashed line. Right: radial profile of the excess counts fit with Eq. (3) beyond the peak emission. The characteristic R(1/e) size of the nebula is indicated by a white (black) dashed line in the left (right) hand plot. The plots are related to the energy bands: 1–3 GeV (top) and 3–10 GeV (bottom).
Current usage metrics show cumulative count of Article Views (full-text article views including HTML views, PDF and ePub downloads, according to the available data) and Abstracts Views on Vision4Press platform.
Data correspond to usage on the plateform after 2015. The current usage metrics is available 48-96 hours after online publication and is updated daily on week days.
Initial download of the metrics may take a while.