Fig. 10.
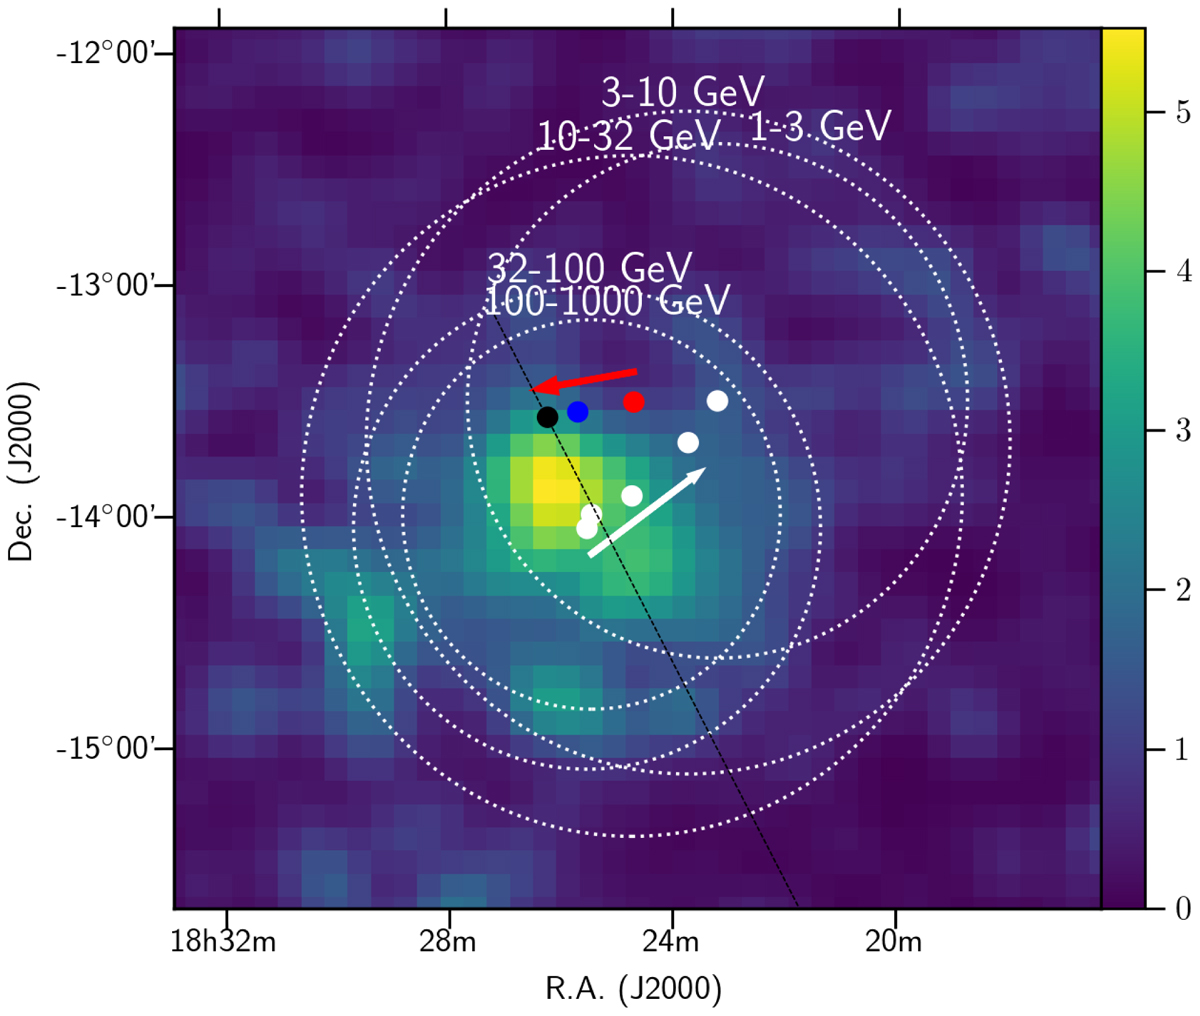
Evolution of the system varying the energy (age) of the emitting particle. Black point: the current PSR position; blue point: birth PSR position at a characteristic age of 21 kyr; red point: birth PSR position for an hypothetical characteristic age of 60 kyr. The white points (circles) corresponds to the centroids (extensions) of the PWN estimated using the 2D-Gaussian method in different energy bands (see Table 2). For the plot, we use the TS map of the energy range 30–100 GeV as background colour map. The current day major axis for the emission as determined from H.E.S.S. is indicated by a black dashed line.
Current usage metrics show cumulative count of Article Views (full-text article views including HTML views, PDF and ePub downloads, according to the available data) and Abstracts Views on Vision4Press platform.
Data correspond to usage on the plateform after 2015. The current usage metrics is available 48-96 hours after online publication and is updated daily on week days.
Initial download of the metrics may take a while.