Fig. 15.
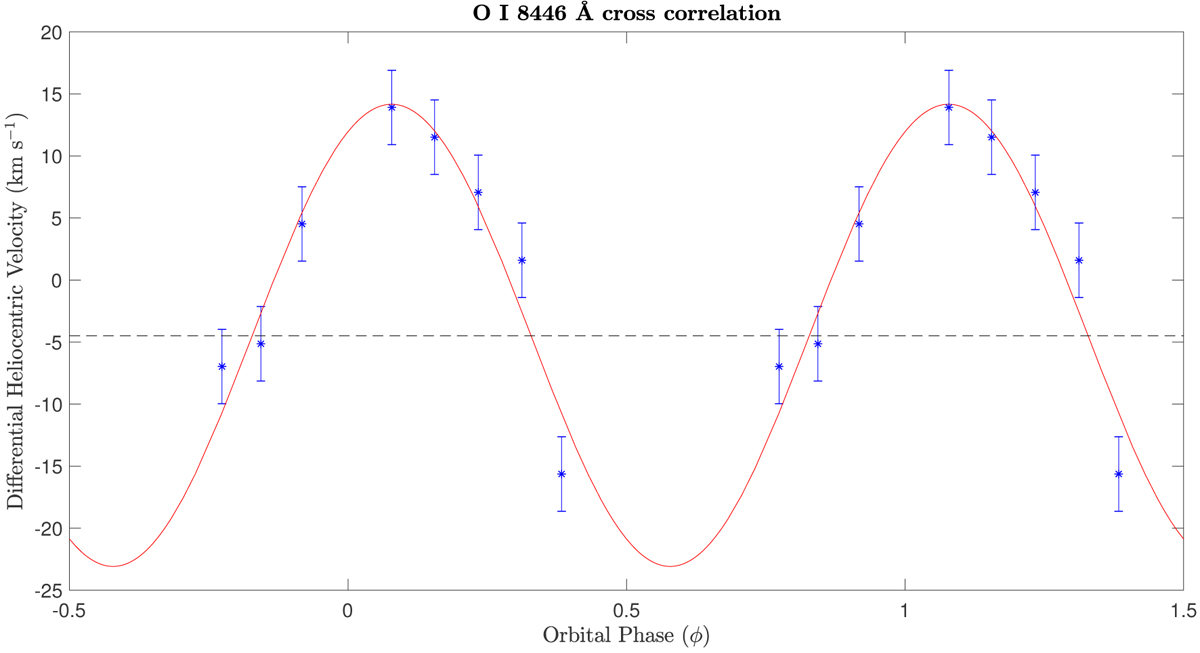
Velocity curve of the O I 8446 Å line from X-shooter. The velocities are from the June dataset at nearly phase-on precessional phase and were cross correlated with the point at ϕ = 0.08. Superposing the γ velocity of the system (from the He II or Si II curve for example) gives a value in agreement with Fig. 14 and with the system velocity, indicating that this line does not come from the disk-wind.
Current usage metrics show cumulative count of Article Views (full-text article views including HTML views, PDF and ePub downloads, according to the available data) and Abstracts Views on Vision4Press platform.
Data correspond to usage on the plateform after 2015. The current usage metrics is available 48-96 hours after online publication and is updated daily on week days.
Initial download of the metrics may take a while.