Fig. 3
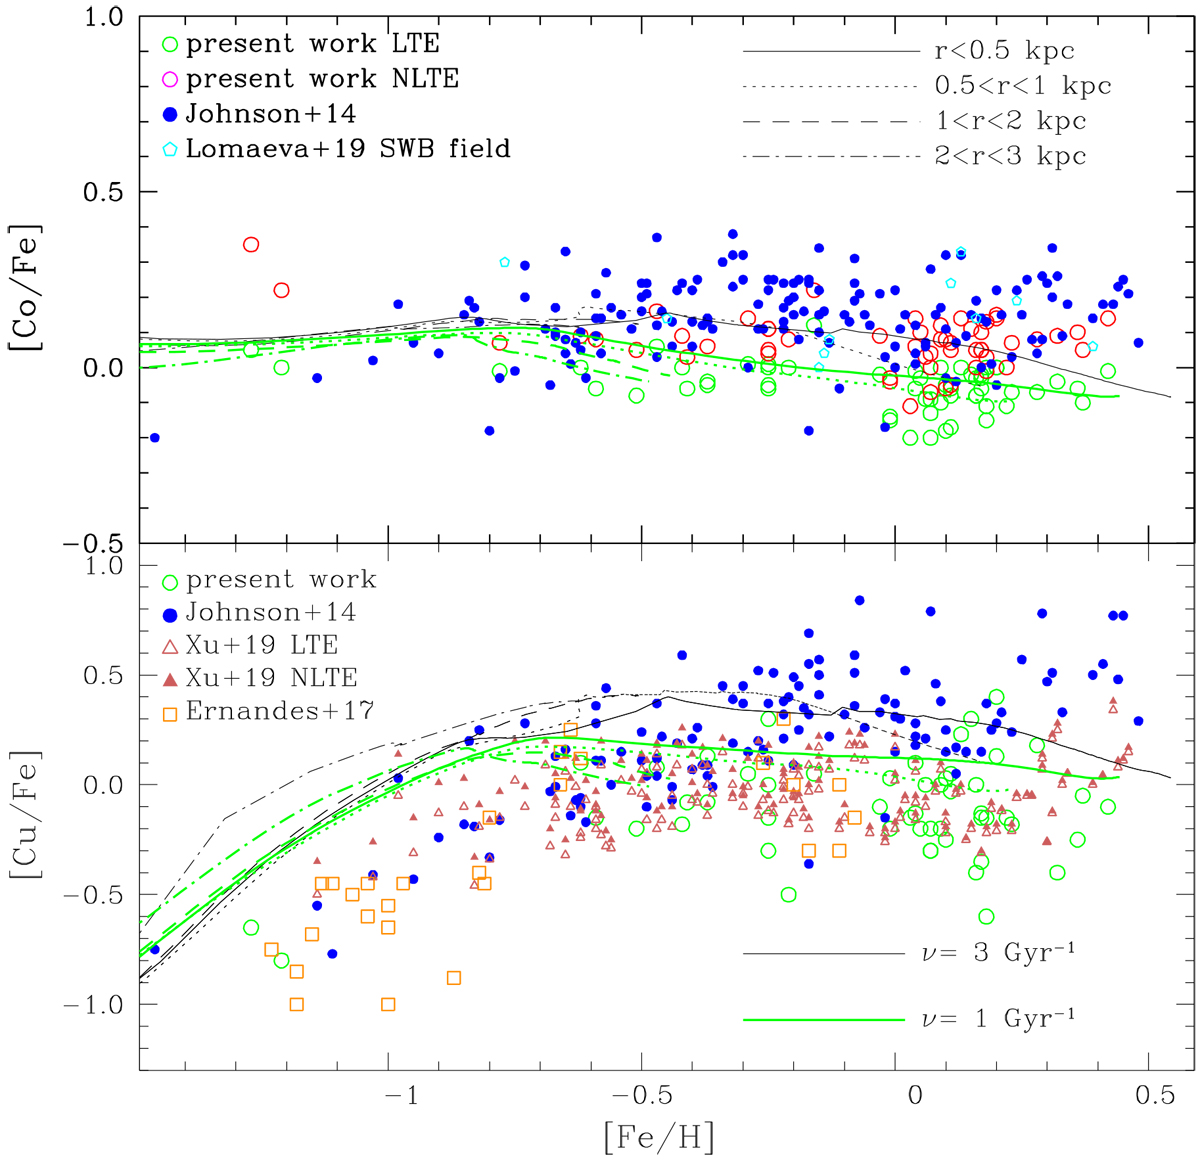
Upper panel: [Co/Fe] vs. [Fe/H] with the present results in LTE and corrected for NLTE, together with literature data. Lower panel: [Cu/Fe] vs. [Fe/H] with the present results and literature data. Shown are: the present results in LTE (open green circles); present results in NLTE (open magenta circles); Johnson et al. (2014) (filled blue circles); Lomaeva et al. (2019) for the SW field (open cyan circles); Xu et al. (2019) in LTE (open Indian red triangles); Xu et al. (2019) in NLTE (filled Indian red triangles); Ernandes et al. (2018) for bulge globular clusters (open dark orange squares) and chemodynamical evolution models are overplotted; specific star formation rates of 3 Gyr−1, with SNII yields from WW95 (black lines); specific star formation rates of 1 Gyr−1, with SNII yields from WW95 and from Kobayashi et al. (2006) for [Fe/H] < −4.0 (green lines). Models are for distances to the Galactic center of: r < 0.5 kpc (solid lines), 0.5 < r < 1 kpc (dotted lines), 1 < r < 2 kpc (dashed lines), and 2 < r < 3 kpc (dash-dotted lines).
Current usage metrics show cumulative count of Article Views (full-text article views including HTML views, PDF and ePub downloads, according to the available data) and Abstracts Views on Vision4Press platform.
Data correspond to usage on the plateform after 2015. The current usage metrics is available 48-96 hours after online publication and is updated daily on week days.
Initial download of the metrics may take a while.