Fig. 4.
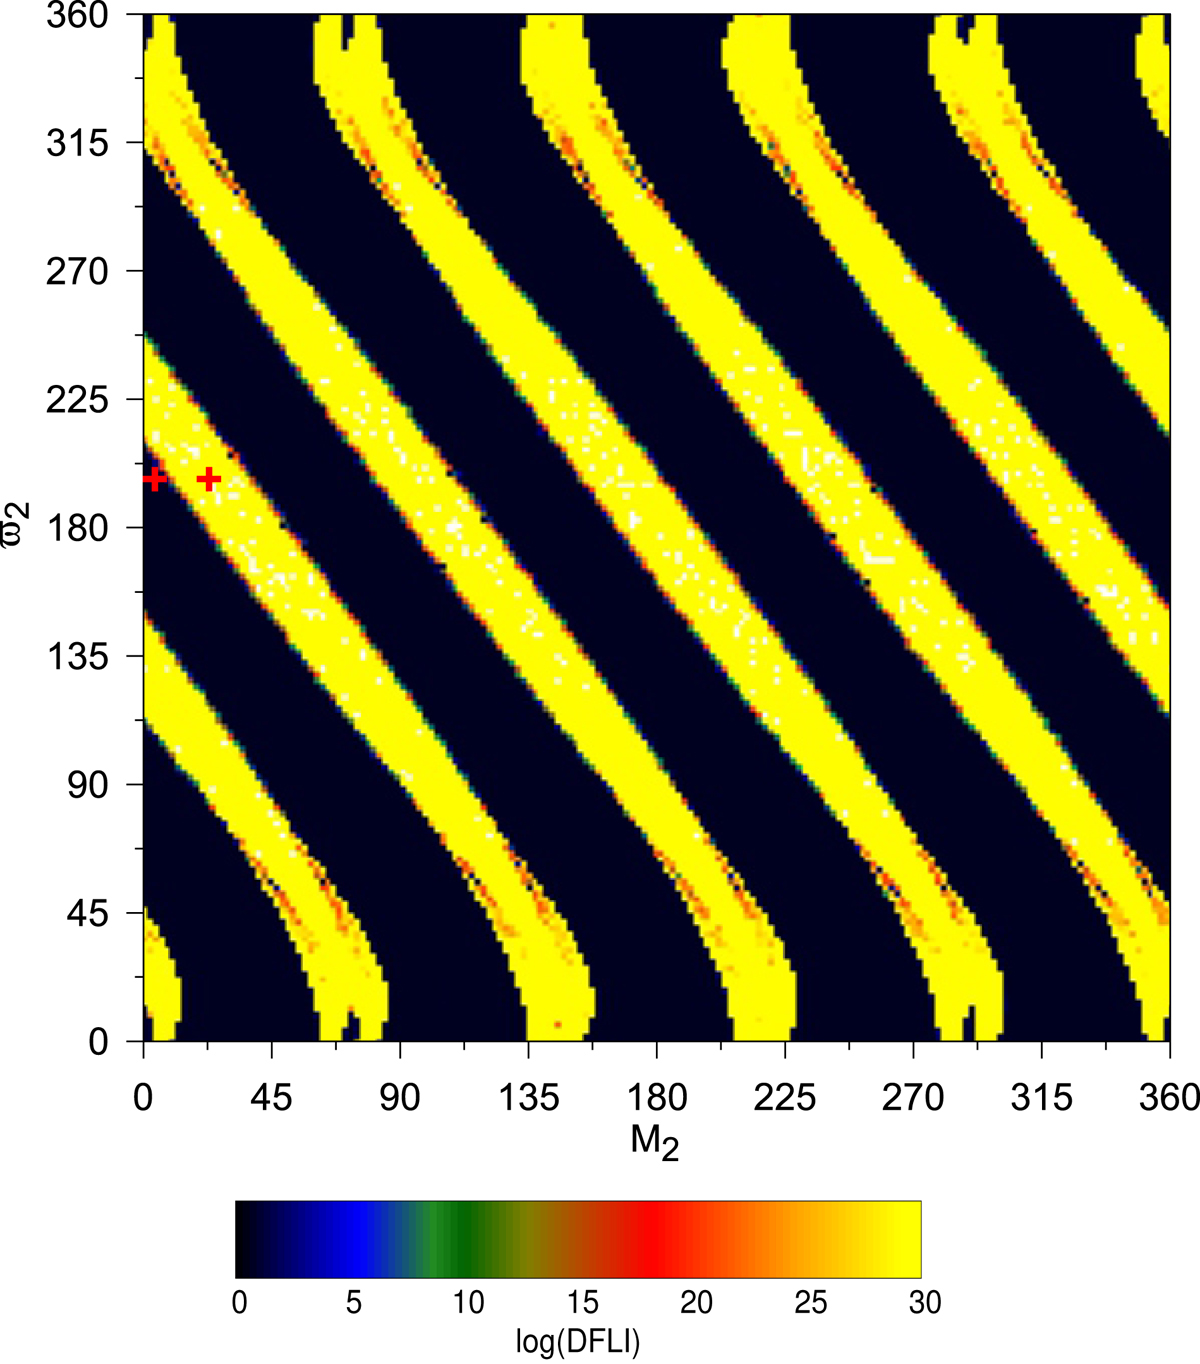
DS map on (M2, ϖ2) plane for K2-21. The long-term stability is guaranteed in the dark-coloured regions. Dark (pale) domains correspond to stable (chaotic) domains in phase space as ascribed by the logarithmic values of the DFLI (coloured bar). The red crosses represent the initial conditions of the evolutions highlighted in Figs. 5 and 6.
Current usage metrics show cumulative count of Article Views (full-text article views including HTML views, PDF and ePub downloads, according to the available data) and Abstracts Views on Vision4Press platform.
Data correspond to usage on the plateform after 2015. The current usage metrics is available 48-96 hours after online publication and is updated daily on week days.
Initial download of the metrics may take a while.