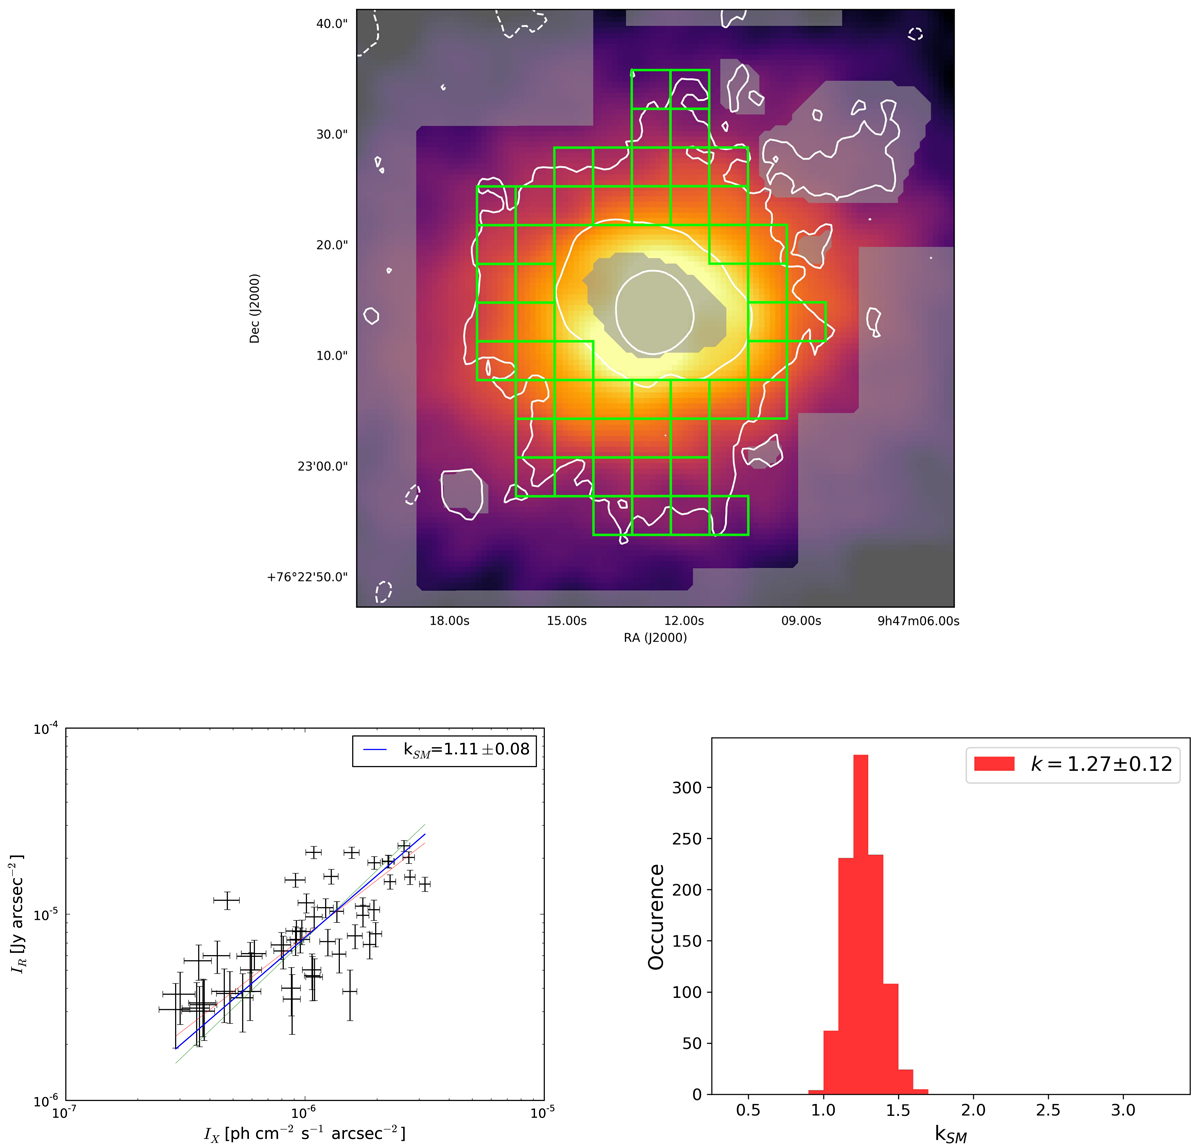
Fig. 1.
Top: Chandra image of the RBS 797 cluster with the contours at the −3, 3, 24, 96σ levels of the radio emission at 1.4 GHz (Doria et al. 2012). The resolution of the radio maps is 3″ × 3″ and 1σ = 10 μJy beam−1. Shown in green is the final mesh that samples the emission above the 3σ level with cells of 4″ × 4″ size. The central cavities and the external sources were masked (gray) and, therefore they were excluded from the sampling. Bottom-left: IR vs. IX plot where each point corresponds to a cell of the sampling mesh. The red and green lines are, respectively, the best-fit power law estimated for (IR ∣ IX) and (IX ∣ IR). The blue line is their bisector power law. The value of kSM is reported in the legend. Bottom-right: histogram of the distribution of values of kSM produced by the Monte Carlo point-to-point analysis with 1000 cycles. The best estimate of k is reported in the legend with the associated 1σ error.
Current usage metrics show cumulative count of Article Views (full-text article views including HTML views, PDF and ePub downloads, according to the available data) and Abstracts Views on Vision4Press platform.
Data correspond to usage on the plateform after 2015. The current usage metrics is available 48-96 hours after online publication and is updated daily on week days.
Initial download of the metrics may take a while.