Fig. 9.
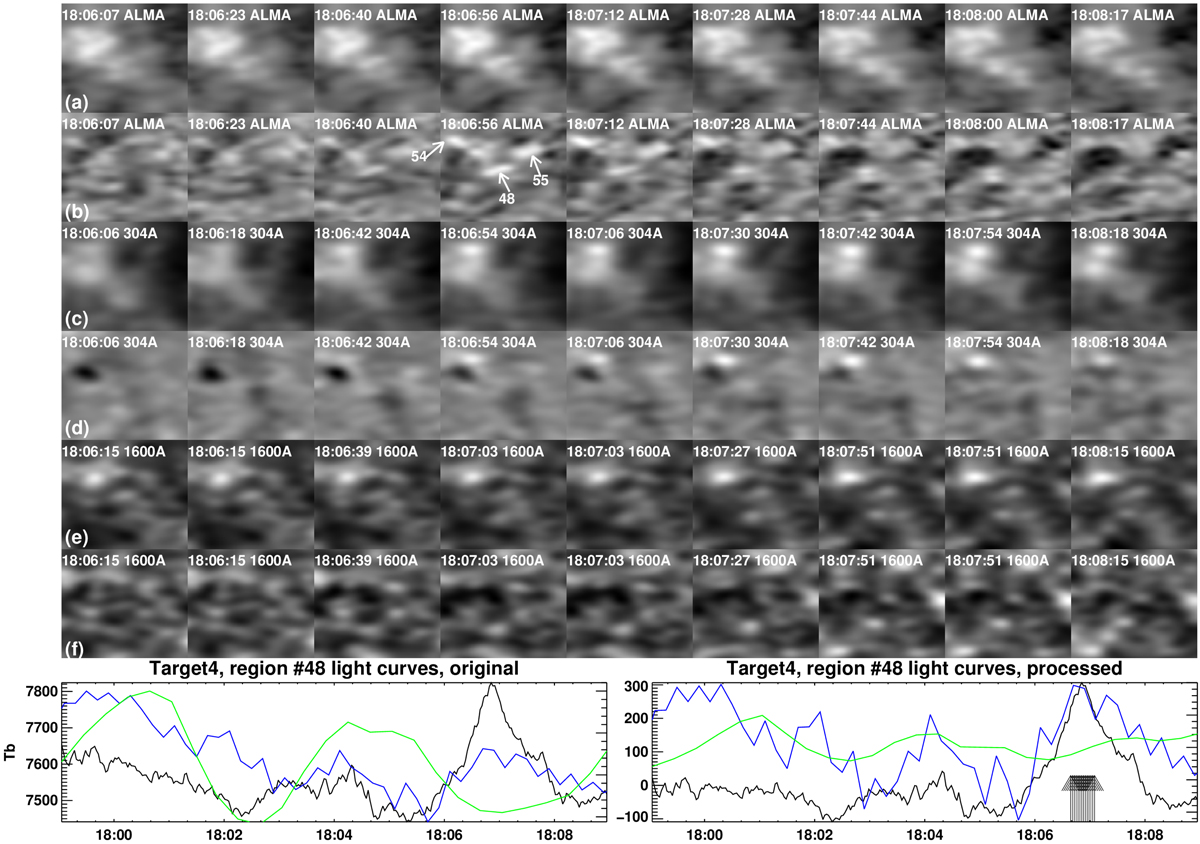
Same as Fig. 7 for an event (number 48) that was detected in 3 mm data but did not show any conspicuous signature in AIA data. The layout of the figure is the same as that of Fig. 7 with the exception that in the bottom row the blue and green curves represent light curves from 304 Å and 1600 Å data, respectively, calculated from the pixels that correspond to the ALMA transient brightening.
Current usage metrics show cumulative count of Article Views (full-text article views including HTML views, PDF and ePub downloads, according to the available data) and Abstracts Views on Vision4Press platform.
Data correspond to usage on the plateform after 2015. The current usage metrics is available 48-96 hours after online publication and is updated daily on week days.
Initial download of the metrics may take a while.