Fig. 8.
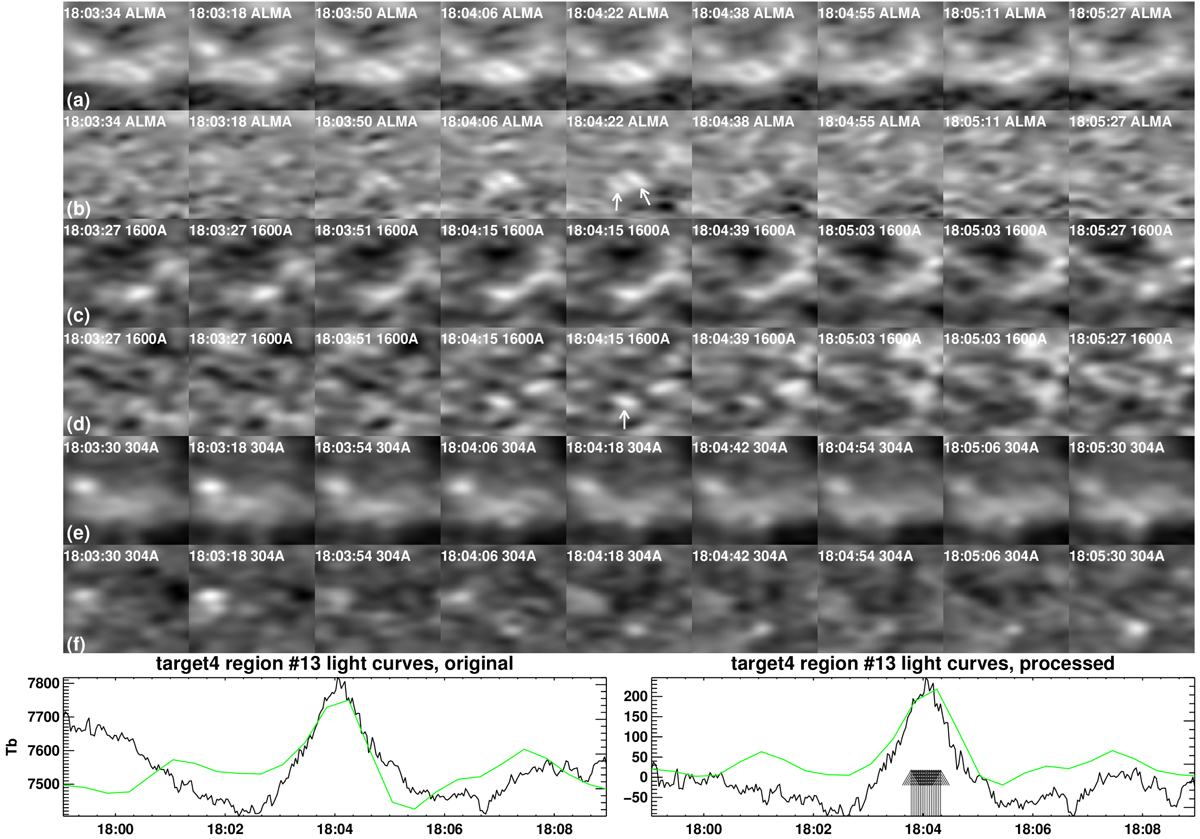
Same as Fig. 7 for an event that was detected both in 3 mm and 1600 Å data. The layout of the figure is the same as that of Fig. 7 with the following exceptions: rows c and d correspond to 1600 Å data while rows e and f correspond to 304 Å data. The white arrows indicate the event at 3 mm and 1600 Å. In the bottom row the green curves show light curves from the 1600 Å data; these light curves are in arbitrary units, normalized to fit the vertical extent of the ALMA plots.
Current usage metrics show cumulative count of Article Views (full-text article views including HTML views, PDF and ePub downloads, according to the available data) and Abstracts Views on Vision4Press platform.
Data correspond to usage on the plateform after 2015. The current usage metrics is available 48-96 hours after online publication and is updated daily on week days.
Initial download of the metrics may take a while.