Fig. 7.
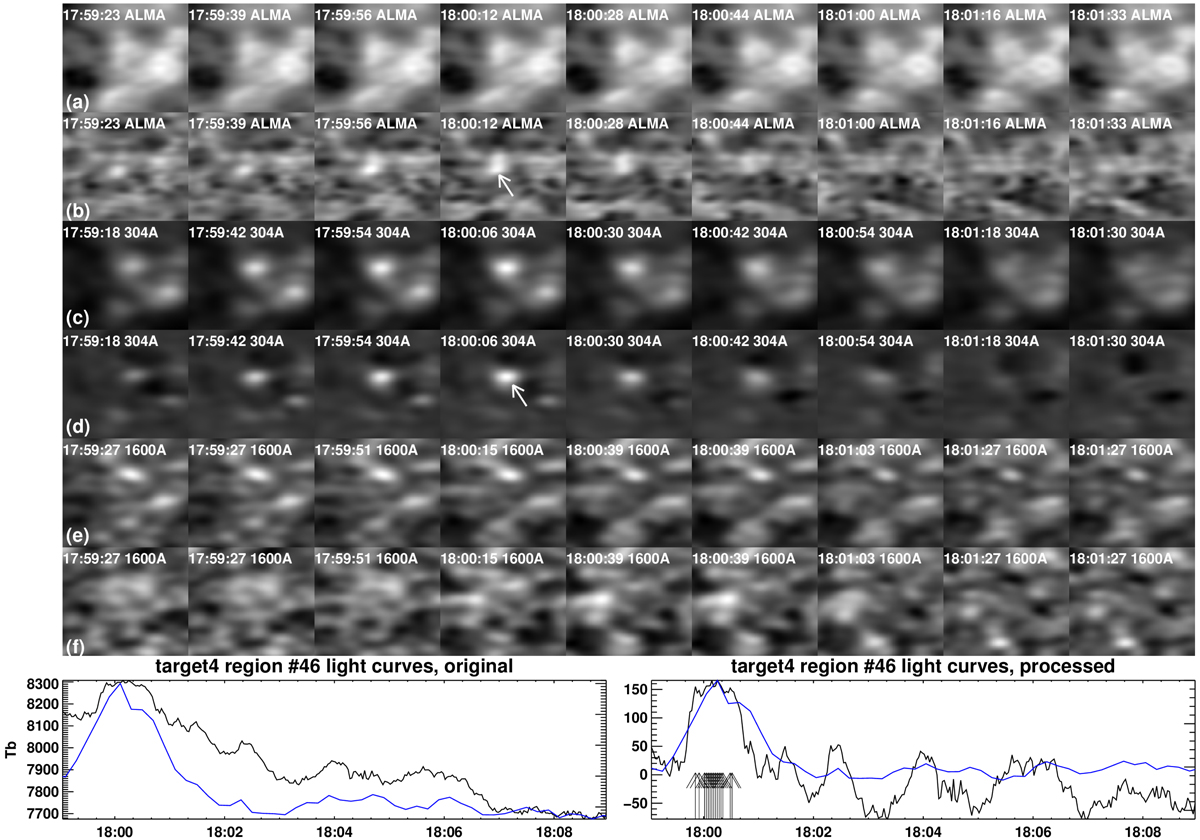
A transient brightening detected both in 3 mm and 304 Å target 4 data. Row a: characteristic ALMA snapshots with field of view of 35″ × 35″; while row b shows the same snapshots after the subtraction of the average ALMA image. Rows c–f: same as rows a and b but for the 304 Å data (rows c and d), and the 1600 Å data (rows e and f). The white arrows indicate the transient brightening in the ALMA and 304 Å data. Bottom row: time profiles of the event emission at 3 mm (black curves) and 304 Å (blue curves), before (left panel) and after (right panel) our processing; the processed light curves show values above the background level. The 304 Å light curves are in arbitrary units, normalized to fit the vertical extent of the ALMA plots.
Current usage metrics show cumulative count of Article Views (full-text article views including HTML views, PDF and ePub downloads, according to the available data) and Abstracts Views on Vision4Press platform.
Data correspond to usage on the plateform after 2015. The current usage metrics is available 48-96 hours after online publication and is updated daily on week days.
Initial download of the metrics may take a while.