Fig. 5.
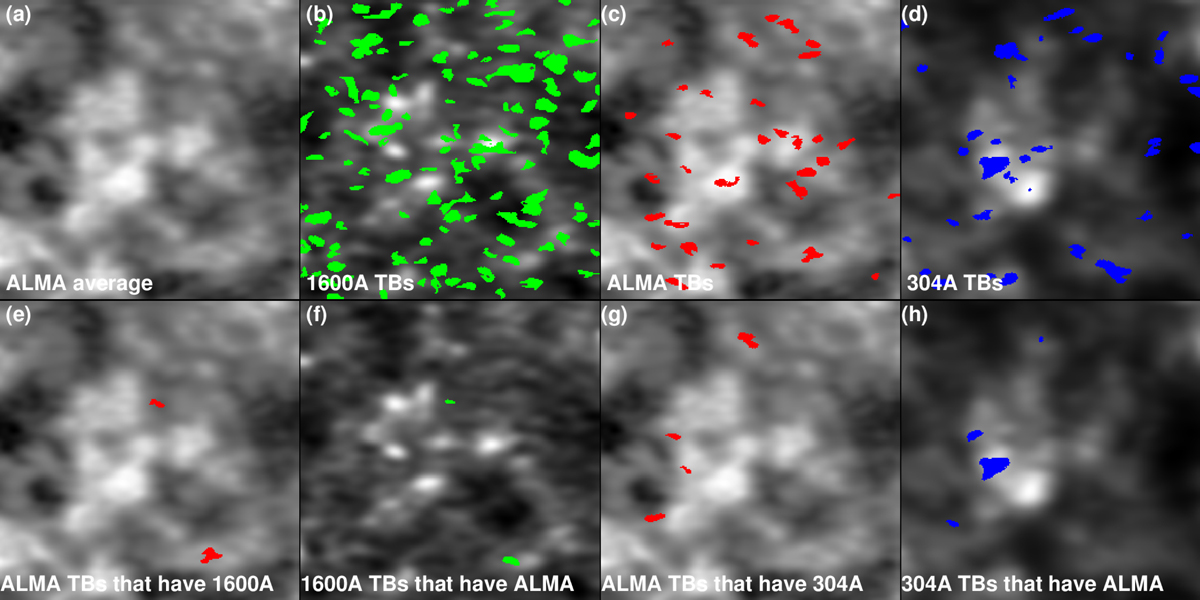
Display of the selected pixels that correspond to transient brightenings in 1600 Å (green), 3 mm (red), and 304 Å (blue) target 4 data. Top row: all events detected at a given wavelength are denoted. Bottom row: panels e and f show only the events that appear both at 3 mm and 1600 Å, respectively, while panels g and h show only the events that appear both at 3 mm and 304 Å, respectively. In each panel the relevant average image is shown as background.
Current usage metrics show cumulative count of Article Views (full-text article views including HTML views, PDF and ePub downloads, according to the available data) and Abstracts Views on Vision4Press platform.
Data correspond to usage on the plateform after 2015. The current usage metrics is available 48-96 hours after online publication and is updated daily on week days.
Initial download of the metrics may take a while.