Fig. 4.
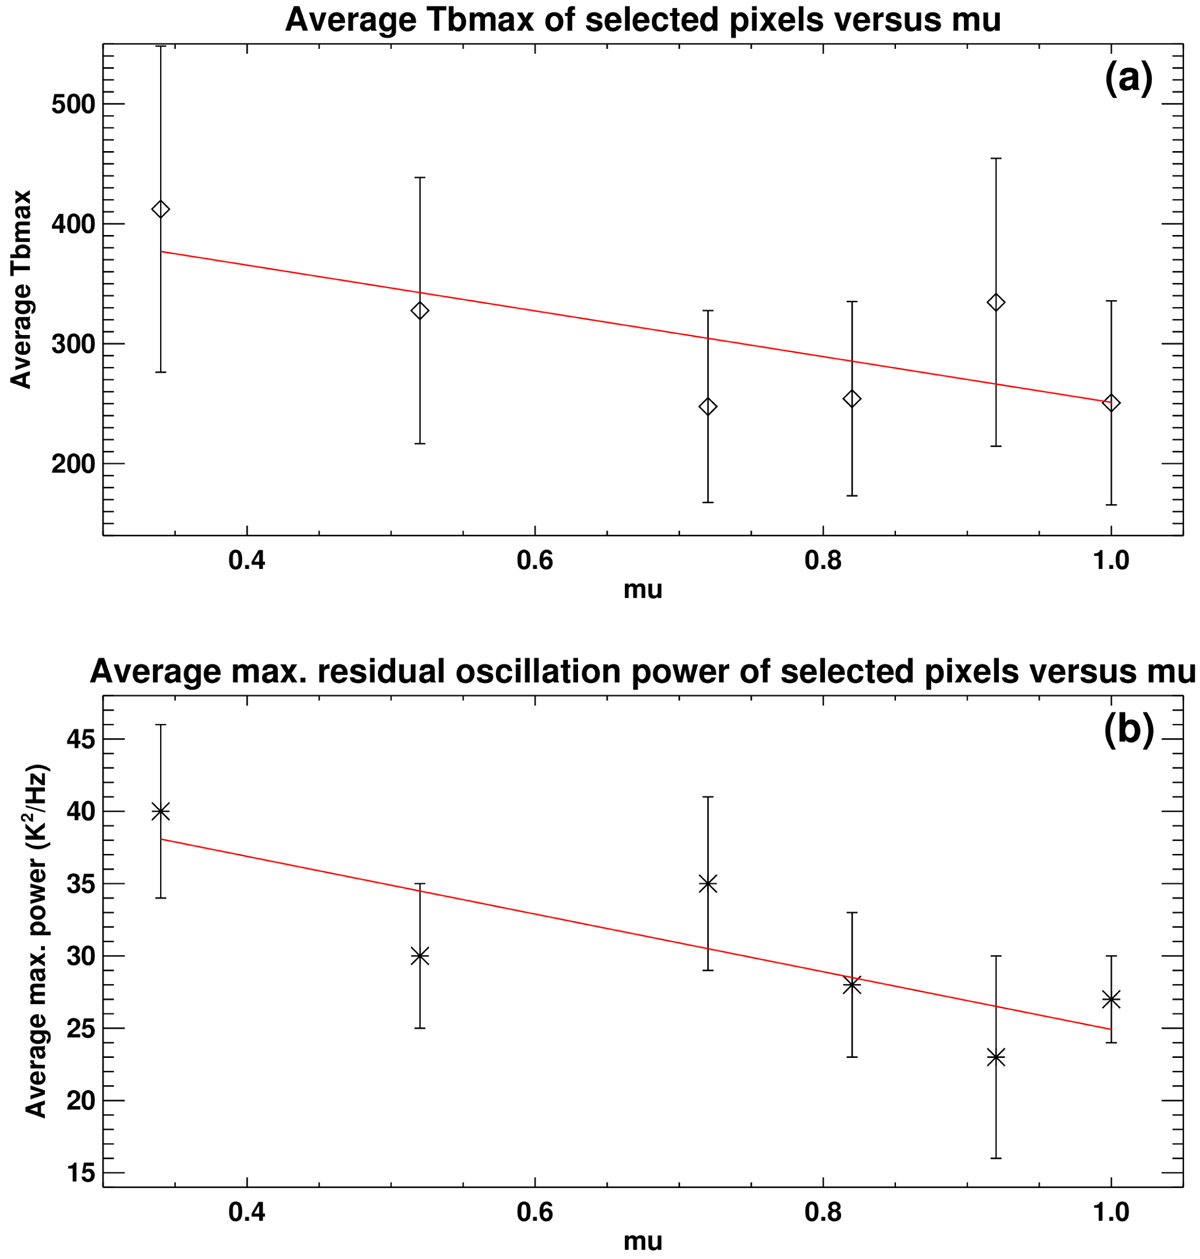
Top: average maximum brightness temperature of the selected event pixels in each target as a function of μ. The error bars denote the standard deviation of the corresponding distributions. The red line shows the linear-squares fit to the measurements. Bottom: same as top, but for the average maximum residual oscillation power.
Current usage metrics show cumulative count of Article Views (full-text article views including HTML views, PDF and ePub downloads, according to the available data) and Abstracts Views on Vision4Press platform.
Data correspond to usage on the plateform after 2015. The current usage metrics is available 48-96 hours after online publication and is updated daily on week days.
Initial download of the metrics may take a while.