Fig. 10.
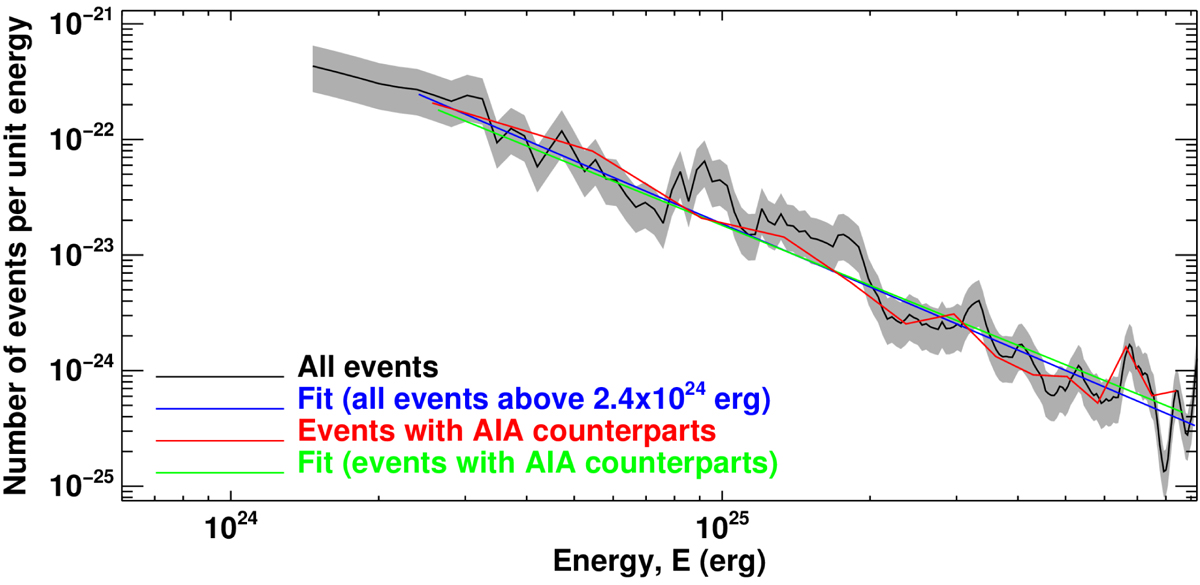
Frequency distribution of all ALMA transient brightenings as a function of energy shown with black curve. The gray band represents the error bars discussed in Sect. 4. For energies > 2.4 × 1024 erg, the frequency distribution of events has been fitted with a power-law function with index of 1.67 (blue curve). The red curve corresponds to the frequency distribution vs. energy of only those ALMA events that have also been detected in AIA data (either 304 Å or 1600 Å). The green curve represents the fitting of that distribution with a power-law function with index of 1.65.
Current usage metrics show cumulative count of Article Views (full-text article views including HTML views, PDF and ePub downloads, according to the available data) and Abstracts Views on Vision4Press platform.
Data correspond to usage on the plateform after 2015. The current usage metrics is available 48-96 hours after online publication and is updated daily on week days.
Initial download of the metrics may take a while.