Open Access
Fig. 8.
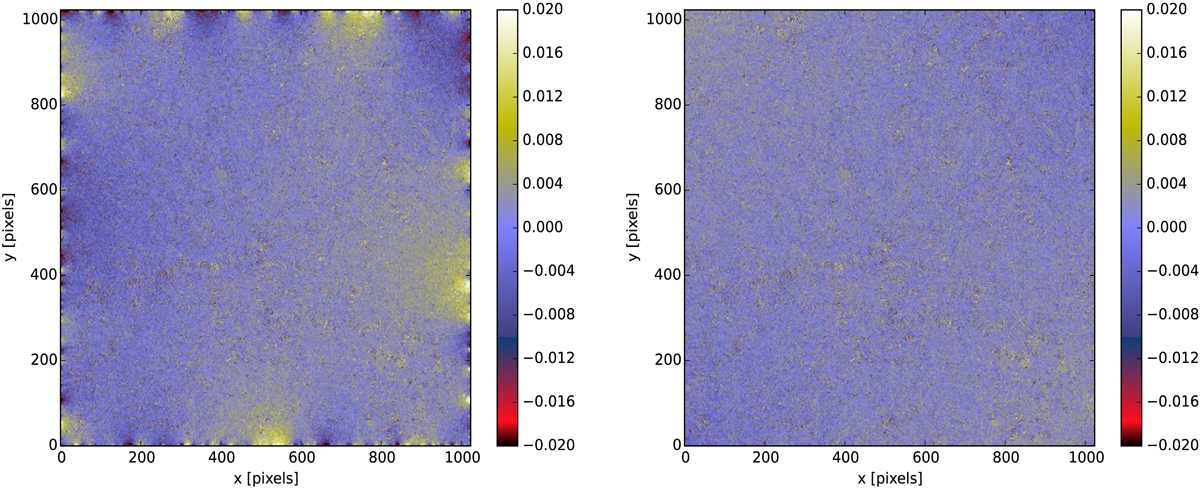
Field border effects: Pixel difference between the original E-mode convergence κ map and the map reconstructed from the corresponding simulated shear maps using the KS method (left) and the KS+ method (right). The field is 10° ×10° downsampled to 1024 × 1024 pixels.
Current usage metrics show cumulative count of Article Views (full-text article views including HTML views, PDF and ePub downloads, according to the available data) and Abstracts Views on Vision4Press platform.
Data correspond to usage on the plateform after 2015. The current usage metrics is available 48-96 hours after online publication and is updated daily on week days.
Initial download of the metrics may take a while.