Fig. 15.
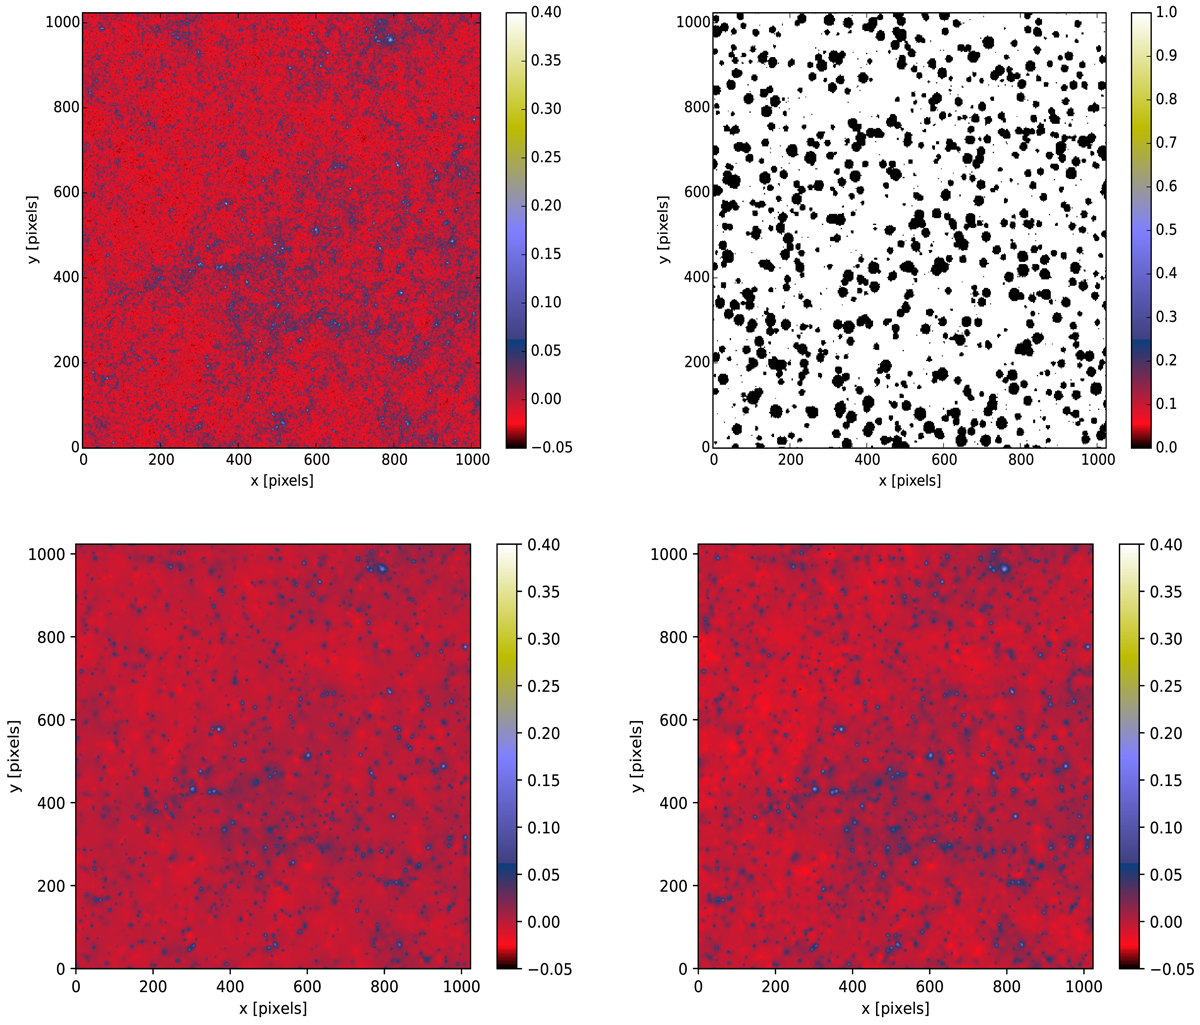
All systematic effects: upper panels: original E-mode convergence κ map (left) and the mask that is applied to the shear maps (right). Lower panels: convergence map reconstructed from an incomplete noisy shear field using the KS method (left) and using the KS+ method (right) applying a non-linear MRLens filtering with αFDR = 0.05. The field is 10° ×10° downsampled to 1024 × 1024 pixels.
Current usage metrics show cumulative count of Article Views (full-text article views including HTML views, PDF and ePub downloads, according to the available data) and Abstracts Views on Vision4Press platform.
Data correspond to usage on the plateform after 2015. The current usage metrics is available 48-96 hours after online publication and is updated daily on week days.
Initial download of the metrics may take a while.