Fig. 11.
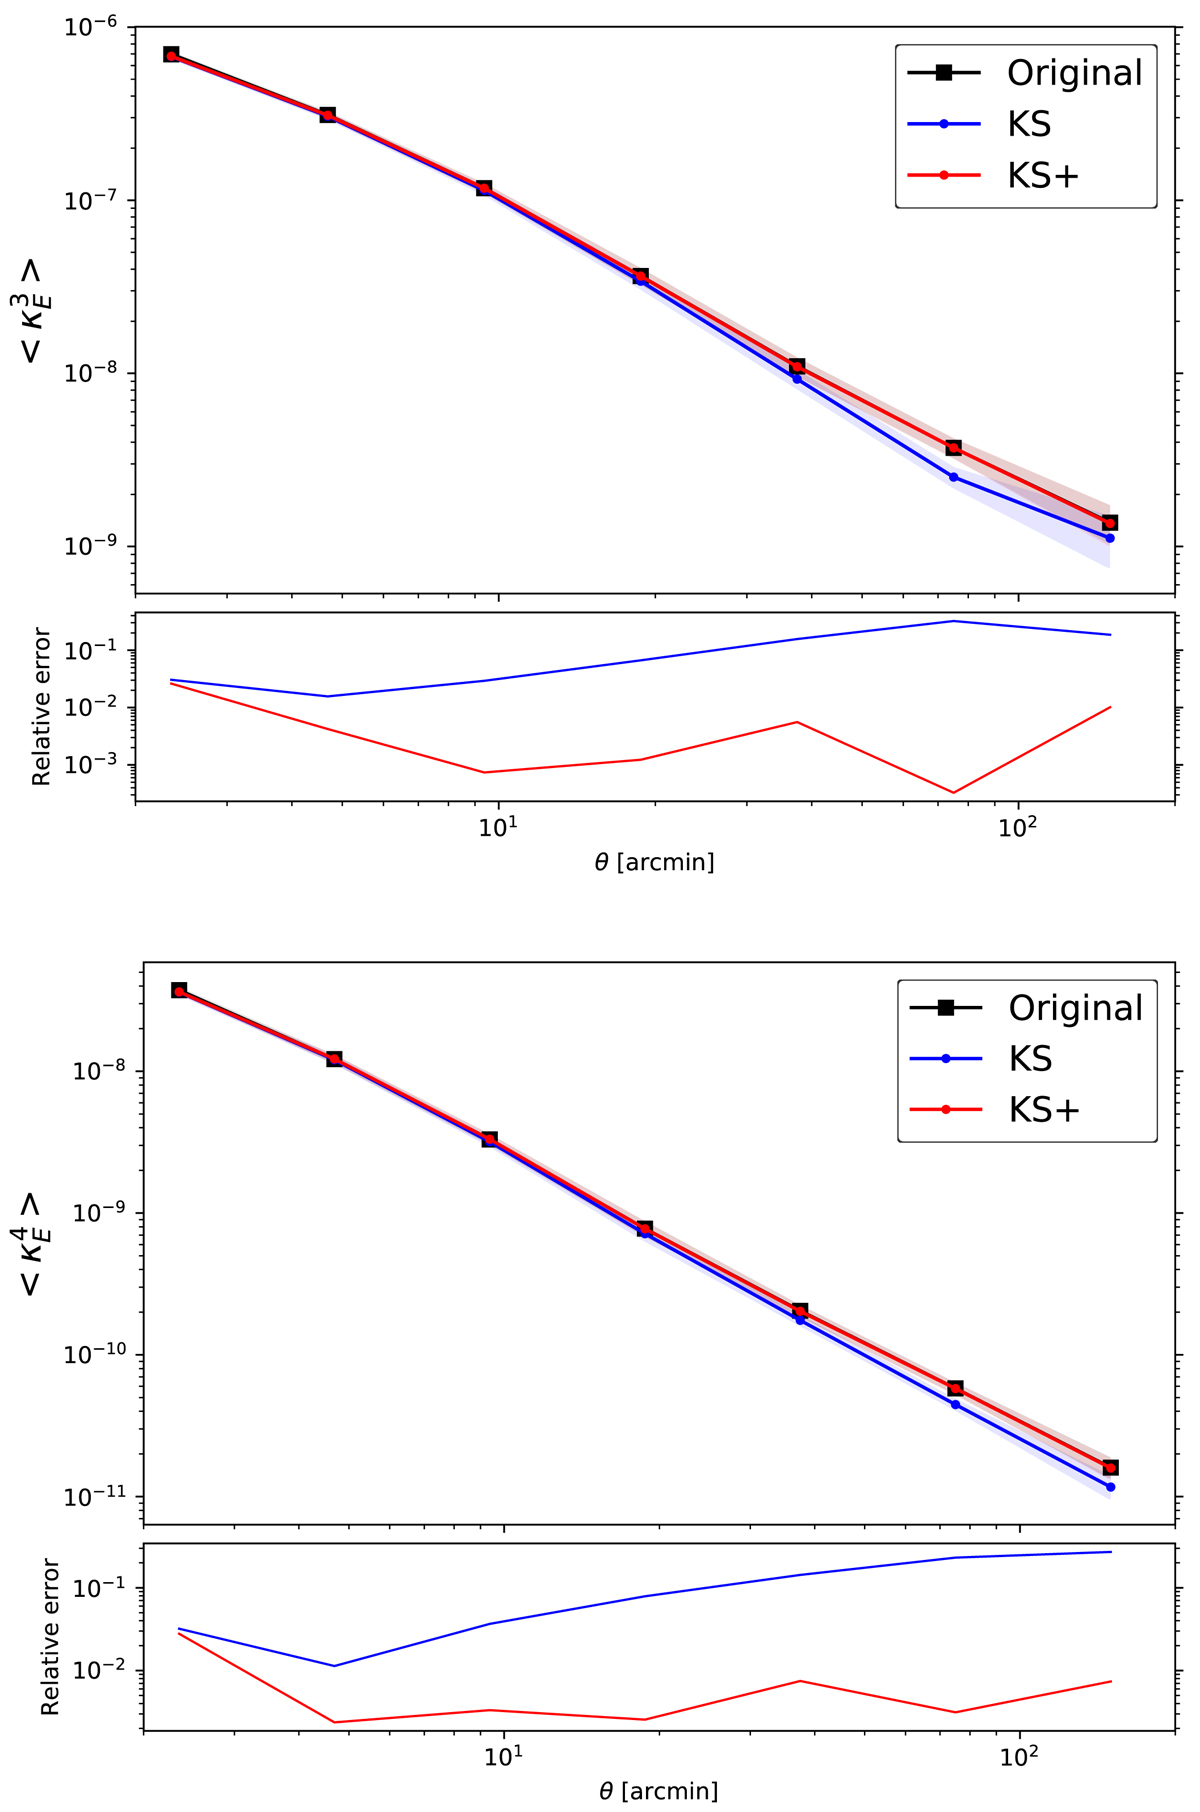
Field border effects: third-order (upper panel) and fourth-order (lower panel) moments estimated on seven wavelet bands of the original convergence (black) compared to the moments estimated on the KS (blue) and KS+ (red) convergence maps reconstructed from noise-free shear maps. The shaded area represents the uncertainties on the mean estimated on 1000 deg2. Lower panel: relative higher-order moment errors introduced by border effects.
Current usage metrics show cumulative count of Article Views (full-text article views including HTML views, PDF and ePub downloads, according to the available data) and Abstracts Views on Vision4Press platform.
Data correspond to usage on the plateform after 2015. The current usage metrics is available 48-96 hours after online publication and is updated daily on week days.
Initial download of the metrics may take a while.