Fig. 10.
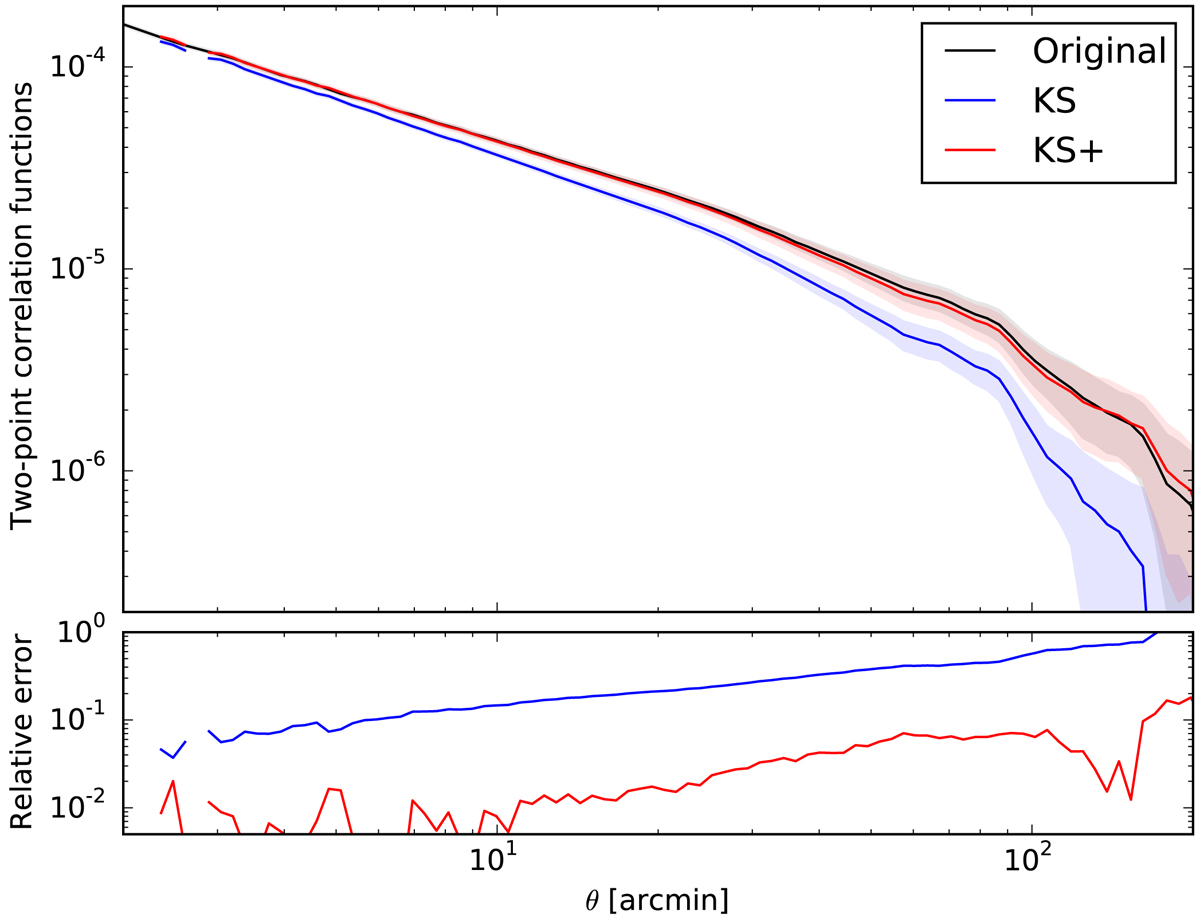
Field border effects: mean shear two-point correlation function ξ+ (black) compared to the corresponding mean convergence two-point correlation function ξκE reconstructed using the KS method (blue) and the KS+ method (red). The shaded area represents the uncertainties on the mean estimated on 1000 deg2. The lower panel shows the relative two-point correlation error introduced by border effects.
Current usage metrics show cumulative count of Article Views (full-text article views including HTML views, PDF and ePub downloads, according to the available data) and Abstracts Views on Vision4Press platform.
Data correspond to usage on the plateform after 2015. The current usage metrics is available 48-96 hours after online publication and is updated daily on week days.
Initial download of the metrics may take a while.