Free Access
Fig. 3.
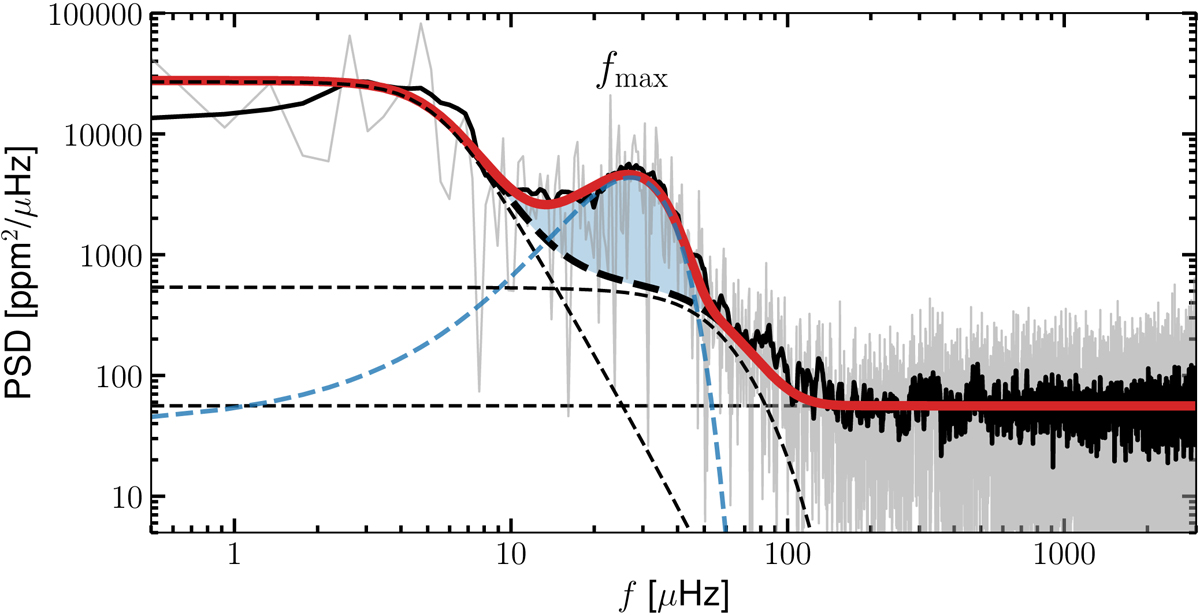
Power spectral density (PSD) for HD 20 based on TESS light-curve data. The thick black line depicts a smoothed version of the PSD (thin gray line) and the best-fit model is shown in red. The blue shaded area indicates the power excess, whereas individual model components are represented by thin blue and black dashed lines.
Current usage metrics show cumulative count of Article Views (full-text article views including HTML views, PDF and ePub downloads, according to the available data) and Abstracts Views on Vision4Press platform.
Data correspond to usage on the plateform after 2015. The current usage metrics is available 48-96 hours after online publication and is updated daily on week days.
Initial download of the metrics may take a while.