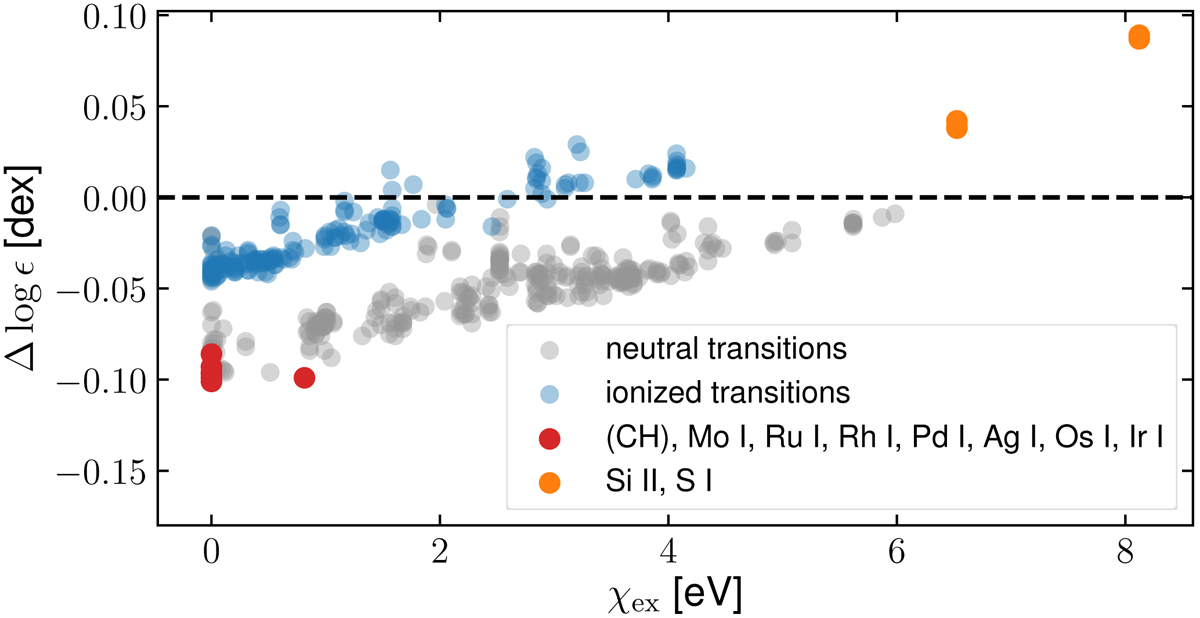
Fig. B.4.

Individual abundance changes from lowering the model Teff by 50 K. Features from neutral species are shown in gray, whereas blue circles indicate ionized species. Highlighted in red and orange are the elements explicitly mentioned in the text. The manifold of CH lines used for synthesis and hence determination of the C abundance are not shown here. Their χex commonly resides around 0 eV.
Current usage metrics show cumulative count of Article Views (full-text article views including HTML views, PDF and ePub downloads, according to the available data) and Abstracts Views on Vision4Press platform.
Data correspond to usage on the plateform after 2015. The current usage metrics is available 48-96 hours after online publication and is updated daily on week days.
Initial download of the metrics may take a while.


