Fig. B.1.
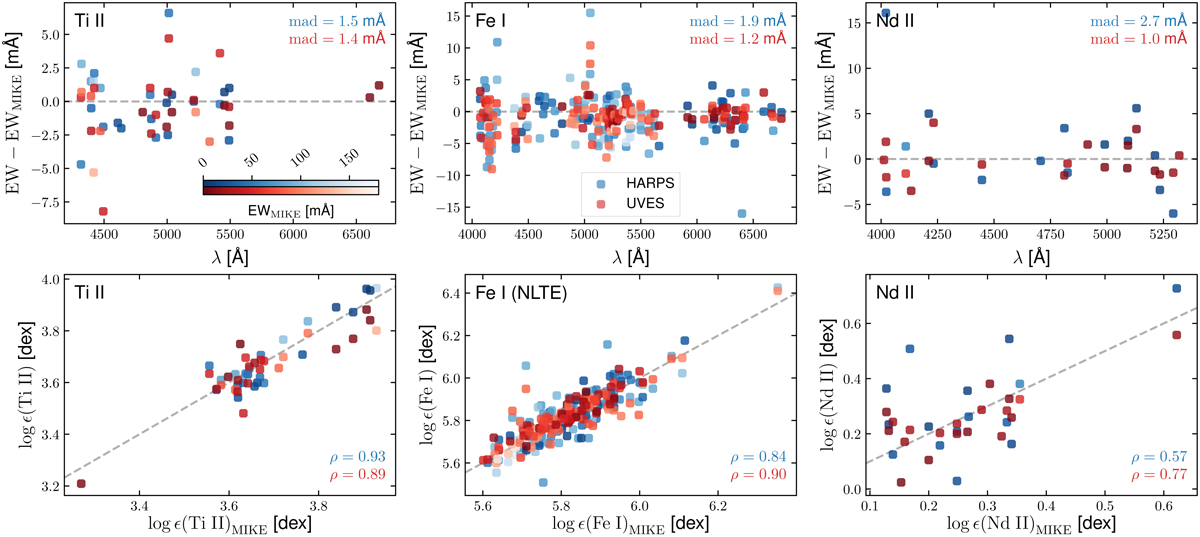
Comparison of EWs (upper panels) and deduced abundances (lower panels) obtained from the same lines that were measured with three different instruments. Panels are horizontally separated by the three representative chemical species (from left to right: Ti II, Fe I, and Nd II). Upper panels: residual EWs between HARPS (blue) and UVES (red) measurements with respect to the corresponding MIKE EWs as a function of wavelength. The lightness of the color stands for the measured EW in the MIKE spectrum as indicated by the color bars in the upper left panel. Lower panels: abundances from the MIKE spectrum are shown on the abscissas, whereas HARPS and UVES findings are given along the ordinates. In each panel the perfect one-to-one correlation is represented by gray dashed lines and the correlation coefficients computed for the samples are presented on the lower right.
Current usage metrics show cumulative count of Article Views (full-text article views including HTML views, PDF and ePub downloads, according to the available data) and Abstracts Views on Vision4Press platform.
Data correspond to usage on the plateform after 2015. The current usage metrics is available 48-96 hours after online publication and is updated daily on week days.
Initial download of the metrics may take a while.