Fig. 15.
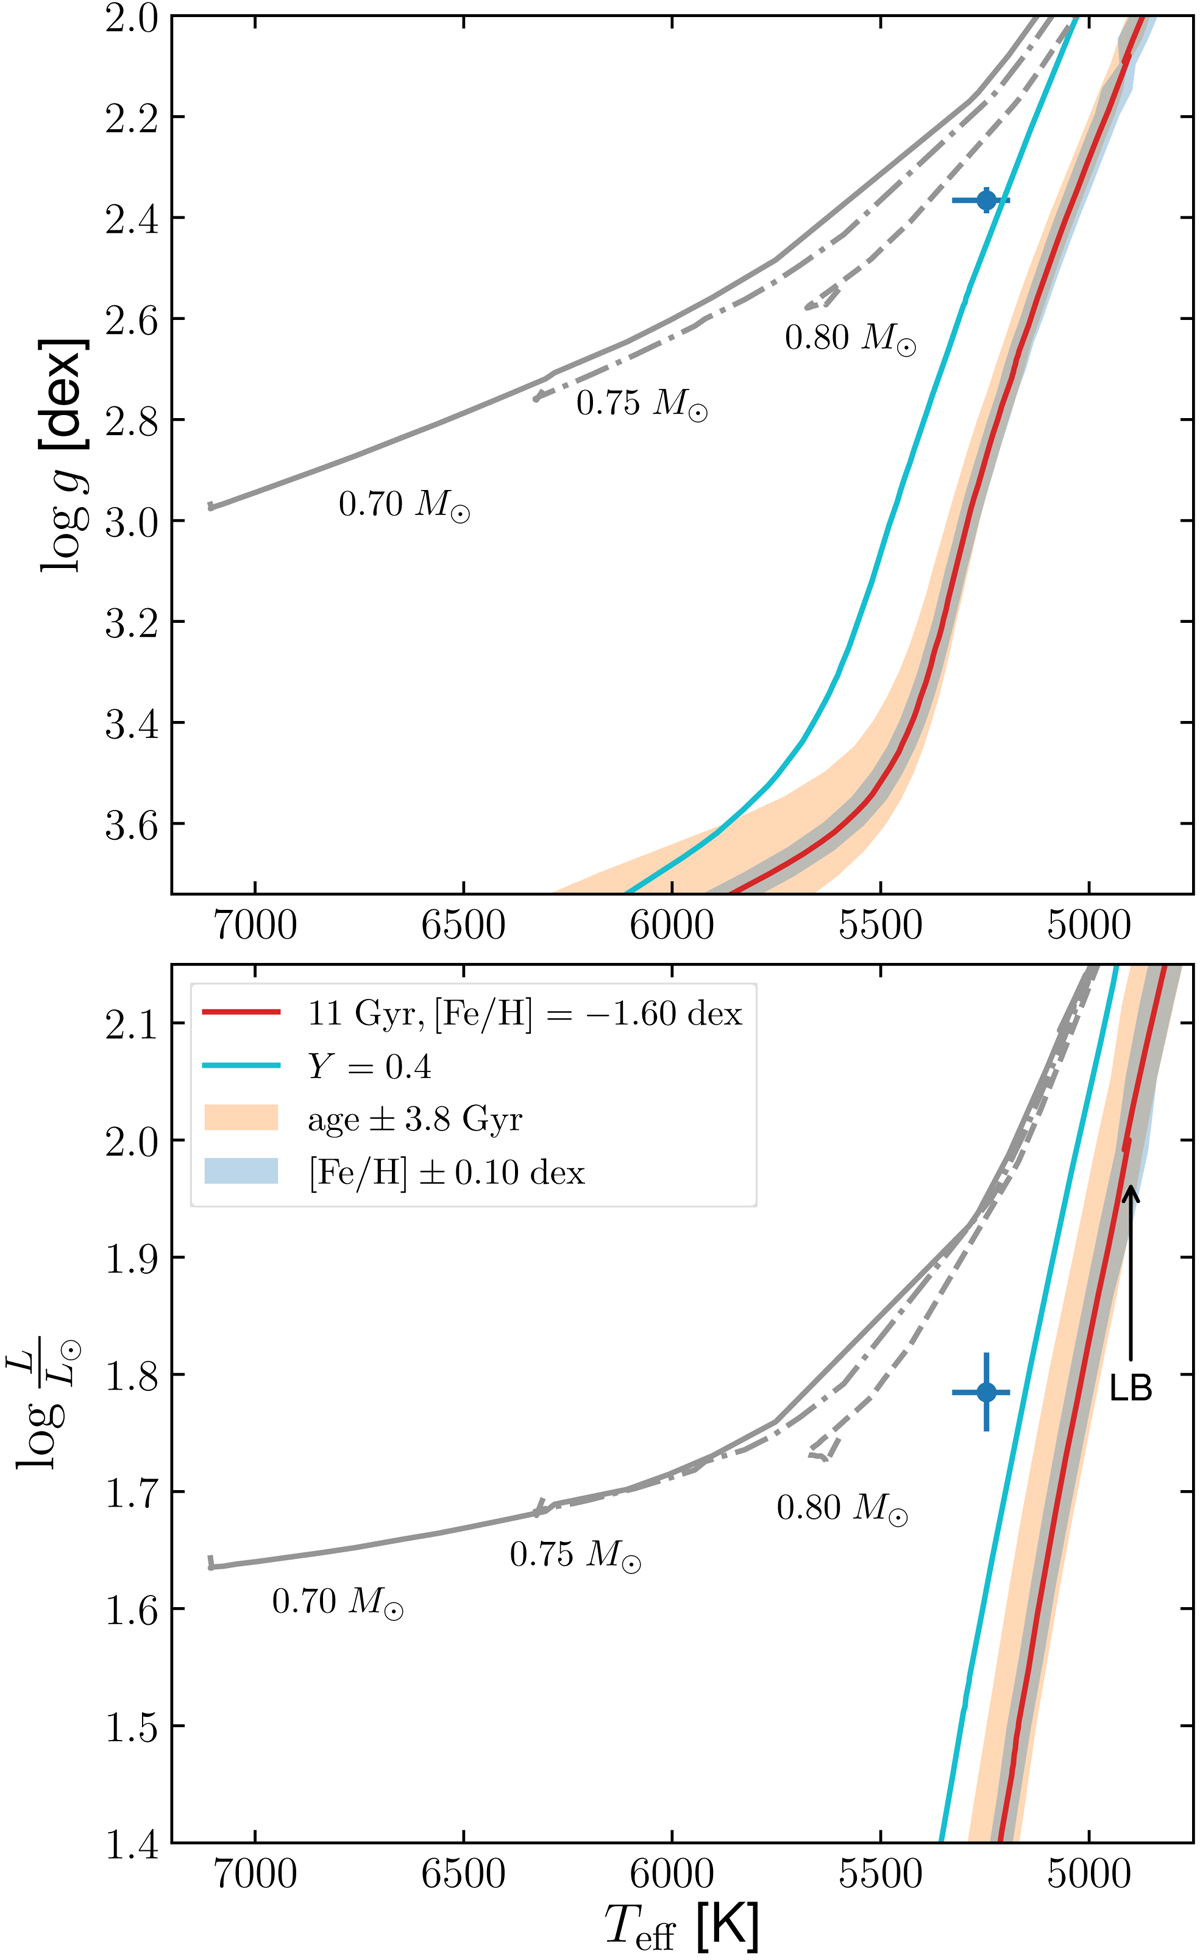
Kiel diagram (upper panel) and Hertzsprung-Russell diagram (lower panel) with isochrones and helium burning tracks. HD 20’s position is depicted by a blue filled circle with error bars. Upper panel: the error on the gravity is smaller than the circle size. The red line represents a He-normal 11 Gyr isochrone at [Fe/H] = −1.60 dex, and [α/Fe] = +0.4 dex with age and metallicity error margins shown by orange and blue ranges. The RGB luminosity bump for this particular model at log L/L⊙ ∼ 2.0 is highlighted in the lower panel by an arrow and the label “LB”. The light blue curve is a model with the same parameters except for Y = 0.4. He-burning tracks for three different masses are shown by gray lines of different line styles with the stellar masses being indicated next to the respective tracks.
Current usage metrics show cumulative count of Article Views (full-text article views including HTML views, PDF and ePub downloads, according to the available data) and Abstracts Views on Vision4Press platform.
Data correspond to usage on the plateform after 2015. The current usage metrics is available 48-96 hours after online publication and is updated daily on week days.
Initial download of the metrics may take a while.