Fig. 14.
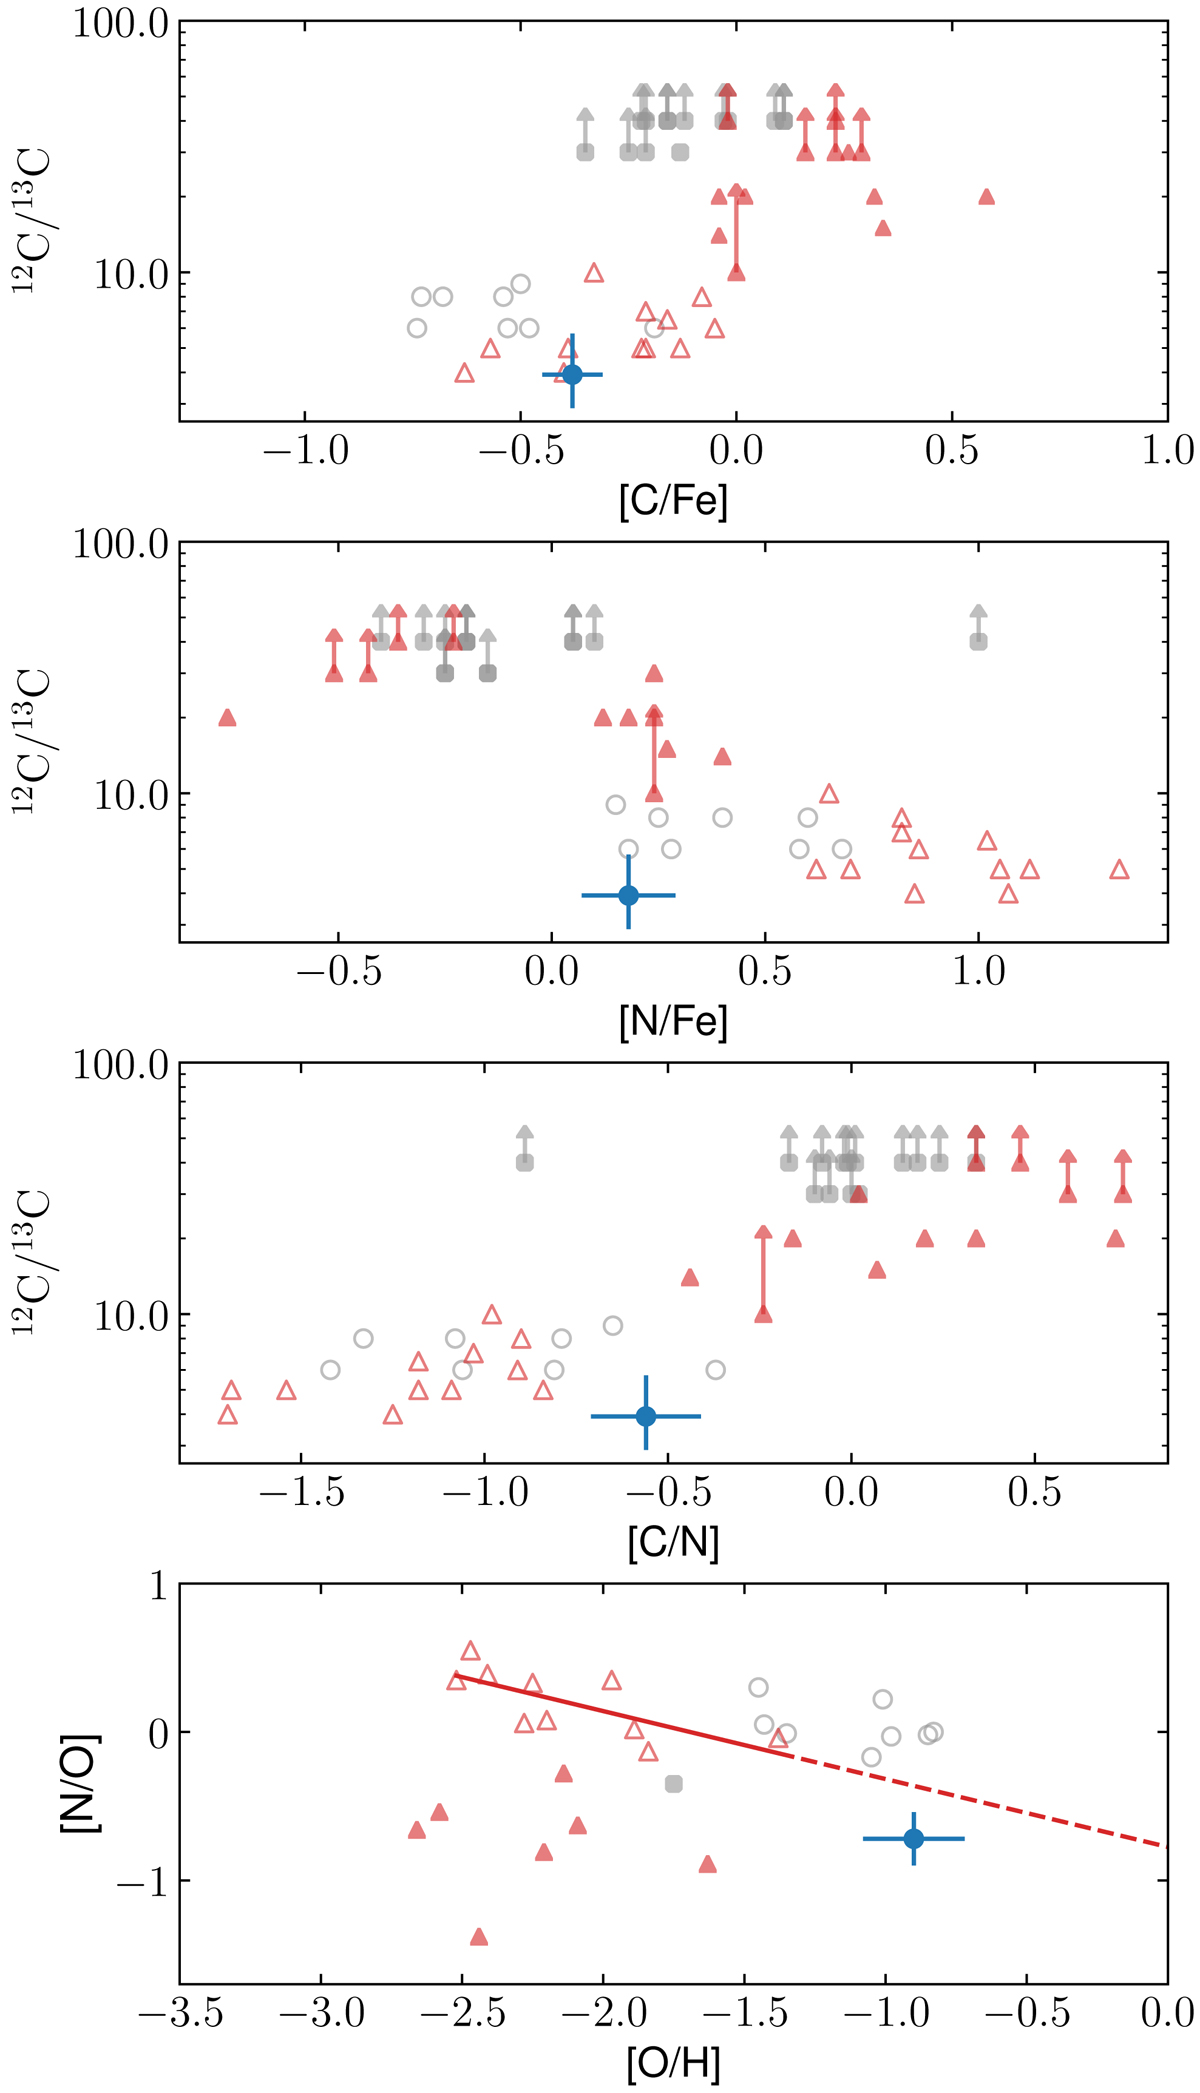
Comparison of CNO elemental abundances of mixed and unmixed stars with HD 20 shown in blue for comparison. Gray circles resemble the study by Gratton et al. (2000) while red triangles indicate the stars published in Spite et al. (2005, 2006). Two C-rich stars were excluded from the latter sample. Lower limits on 12C/13C are indicated by upward pointing arrows and the classification into mixed and unmixed stars according to the authors are represented by open and filled symbols, respectively. The red line in the lower panel mimics the linear relation between [N/O] and [O/H] for mixed stars as reported by Spite et al. (2005), whereas the dashed line extrapolates the same relation to higher values of [O/H].
Current usage metrics show cumulative count of Article Views (full-text article views including HTML views, PDF and ePub downloads, according to the available data) and Abstracts Views on Vision4Press platform.
Data correspond to usage on the plateform after 2015. The current usage metrics is available 48-96 hours after online publication and is updated daily on week days.
Initial download of the metrics may take a while.