Free Access
Fig. 10.
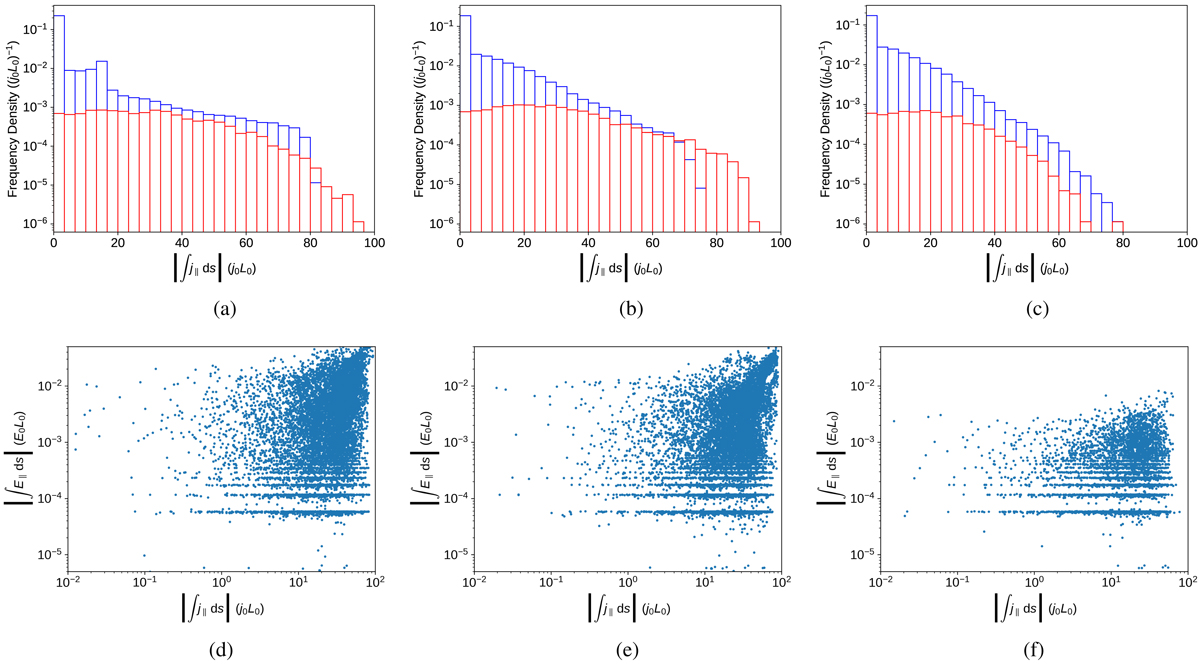
Scatter plots of |E∥| against Ohmic heating at grid points throughout the domain, at times (a) t = 200, (b) t = 325, and (c) t = 400. The red line is an upper bound on E∥ given the value of Ohmic heating and assuming current wholly parallel, i.e. ![]() . The green line shows the minimum possible value of Ohmic heating,
. The green line shows the minimum possible value of Ohmic heating, ![]() .
.
Current usage metrics show cumulative count of Article Views (full-text article views including HTML views, PDF and ePub downloads, according to the available data) and Abstracts Views on Vision4Press platform.
Data correspond to usage on the plateform after 2015. The current usage metrics is available 48-96 hours after online publication and is updated daily on week days.
Initial download of the metrics may take a while.