Fig. 7
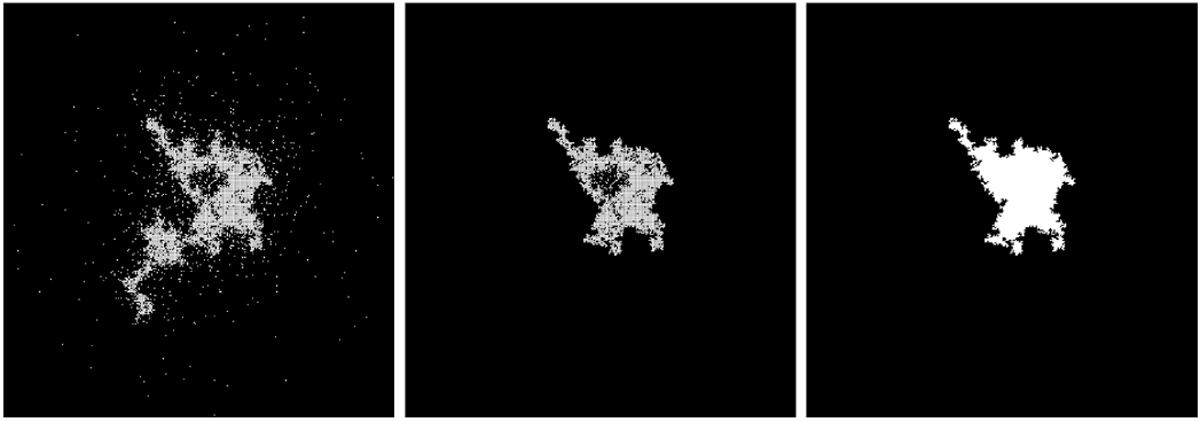
Illustration of the connected area calculated for a flattened aggregate of type RLCA. The flattened particles seen from above is shown on the left. The calculated connected areas are shown with gaps in the middle and without gaps on the right. The parts of the aggregate that are not connected to the largest connected aggregate are removed from the processing.
Current usage metrics show cumulative count of Article Views (full-text article views including HTML views, PDF and ePub downloads, according to the available data) and Abstracts Views on Vision4Press platform.
Data correspond to usage on the plateform after 2015. The current usage metrics is available 48-96 hours after online publication and is updated daily on week days.
Initial download of the metrics may take a while.