Fig. 2
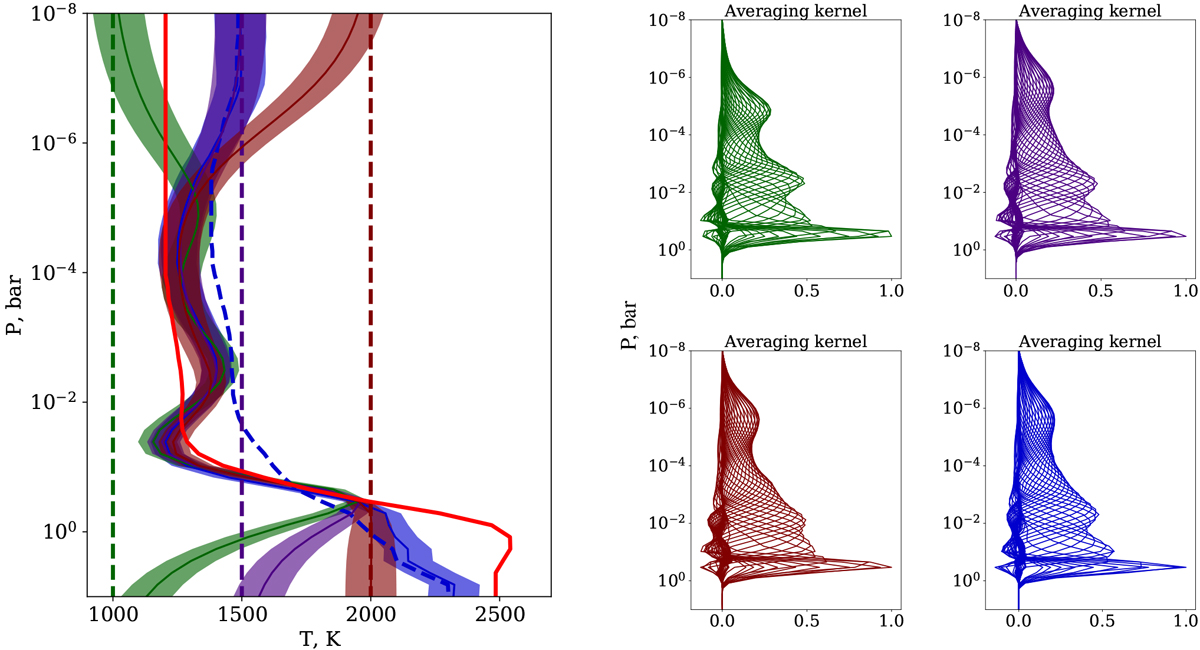
Left panel: retrieved temperature distribution assuming four different initial guesses: three homogeneous at 1000, 1500, and 2000 K (vertical dashed lines), and the one from Waldmann et al. (2015a) (blue dashed line). The retrieved best fit profiles are shown with solid lines along with corresponding error bars as shaded areas. The profile from Lee et al. (2012) is shown as a solid red line. Right panels: averaging kernels for the four retrieved temperature distributions (from left toright and from top to bottom, color-coded accordingly).
Current usage metrics show cumulative count of Article Views (full-text article views including HTML views, PDF and ePub downloads, according to the available data) and Abstracts Views on Vision4Press platform.
Data correspond to usage on the plateform after 2015. The current usage metrics is available 48-96 hours after online publication and is updated daily on week days.
Initial download of the metrics may take a while.