Fig. 1
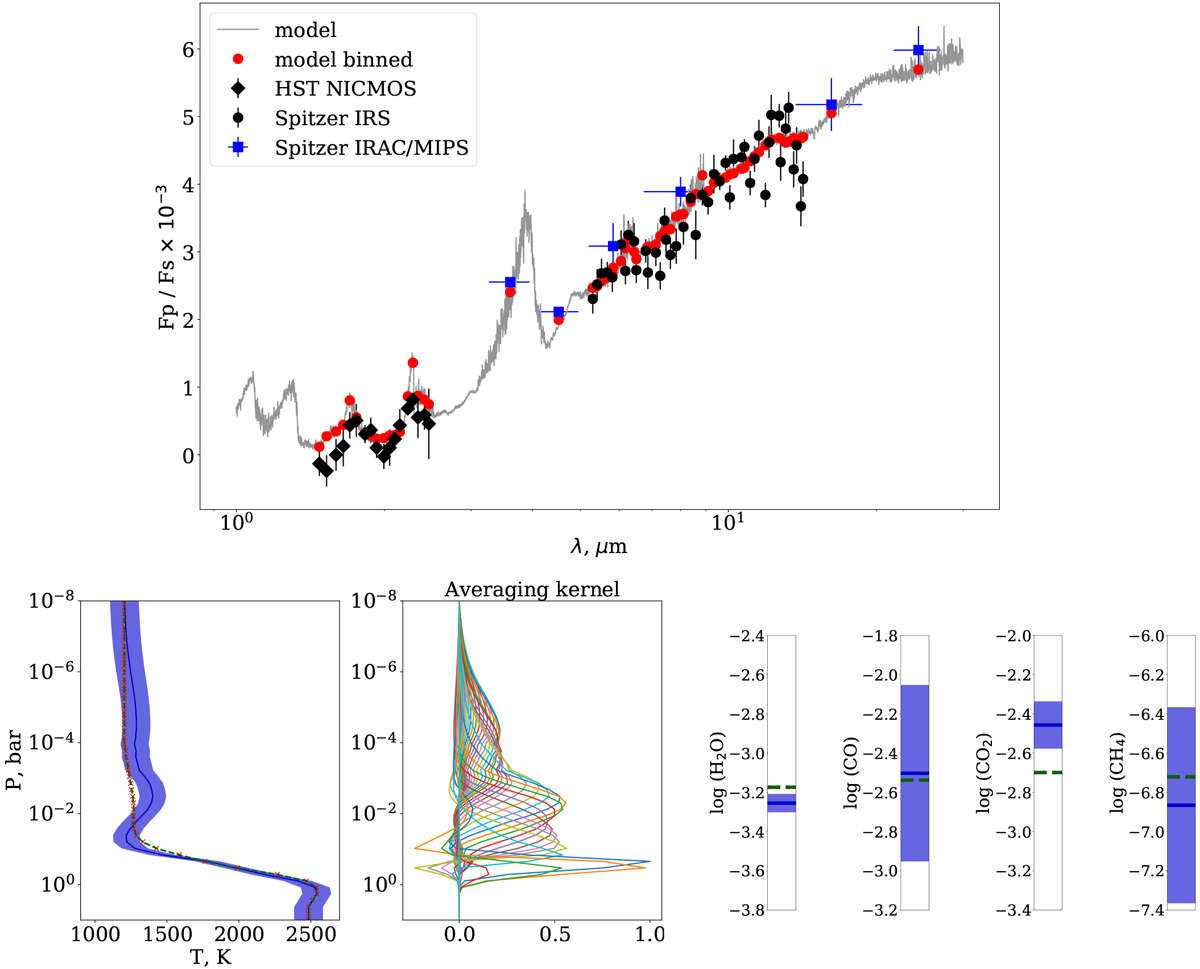
Top panel: observed day side fluxes of HD 189733b and our best fit model predictions (see legend inthe plot). Bottom panels: retrieved T-P profile along with corresponding averaging kernels and mixing ratios of molecular species. We used the T-P profile of Lee et al. (2012) a priori (shown as red crosses). Our best fit model is shown with a solid blue line and the shaded area represents 1σ error bars. The assumed a priori are shown as a green dashed line (which coincides with the red crosses in this particular case). The same color-coding is used for the four side plots of mixing ratios (on the right).
Current usage metrics show cumulative count of Article Views (full-text article views including HTML views, PDF and ePub downloads, according to the available data) and Abstracts Views on Vision4Press platform.
Data correspond to usage on the plateform after 2015. The current usage metrics is available 48-96 hours after online publication and is updated daily on week days.
Initial download of the metrics may take a while.