Fig. 9.
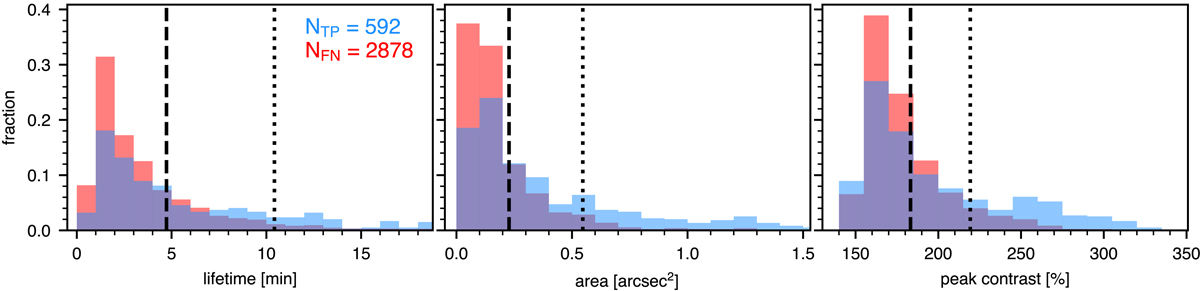
Normalised distribution of AIA false negatives FN (red) and true positives TP (blue) as function of Hα Ellerman bomb lifetime, area, and peak contrast. Overlaps show up violet. The distributions are summations over the two AIA diagnostics, for each using the parameter combination yielding maximum F1, and are normalised by the total numbers specified in the first panel. The vertical lines indicate cut-offs for selecting the top 30% (dashed, N = 521) and 10% (dotted, N = 174) of the Hα Ellerman bombs for each quantity.
Current usage metrics show cumulative count of Article Views (full-text article views including HTML views, PDF and ePub downloads, according to the available data) and Abstracts Views on Vision4Press platform.
Data correspond to usage on the plateform after 2015. The current usage metrics is available 48-96 hours after online publication and is updated daily on week days.
Initial download of the metrics may take a while.