Fig. 7.
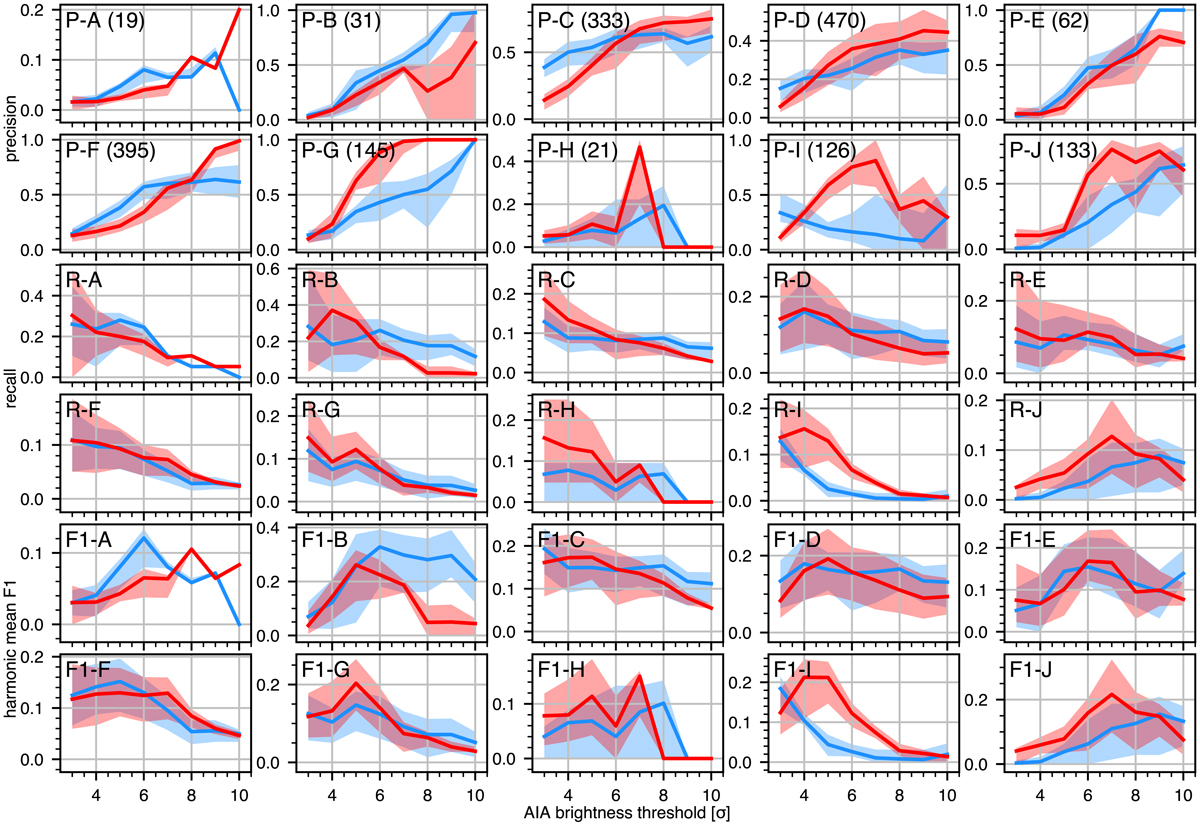
AIA performance metrics precision P (top two rows, P-A–P-J), recall R (middle two rows, R-A–R-J) and the F1 score (bottom two rows, F1-A–F1-J) as function of the imposed AIA brightness threshold for data sets A–J (specified at top left per panel, in the top two rows with the number of Hα detections). In each panel the solid curves trace the averages for 1600 Å (blue) and 1700 Å (red), with correspondingly coloured shading (and darker overlaps) showing the spread per threshold that results from the different additional area and lifetime constraints in the AIA detection grid. The y-axis scales differ per panel.
Current usage metrics show cumulative count of Article Views (full-text article views including HTML views, PDF and ePub downloads, according to the available data) and Abstracts Views on Vision4Press platform.
Data correspond to usage on the plateform after 2015. The current usage metrics is available 48-96 hours after online publication and is updated daily on week days.
Initial download of the metrics may take a while.