Fig. 6.
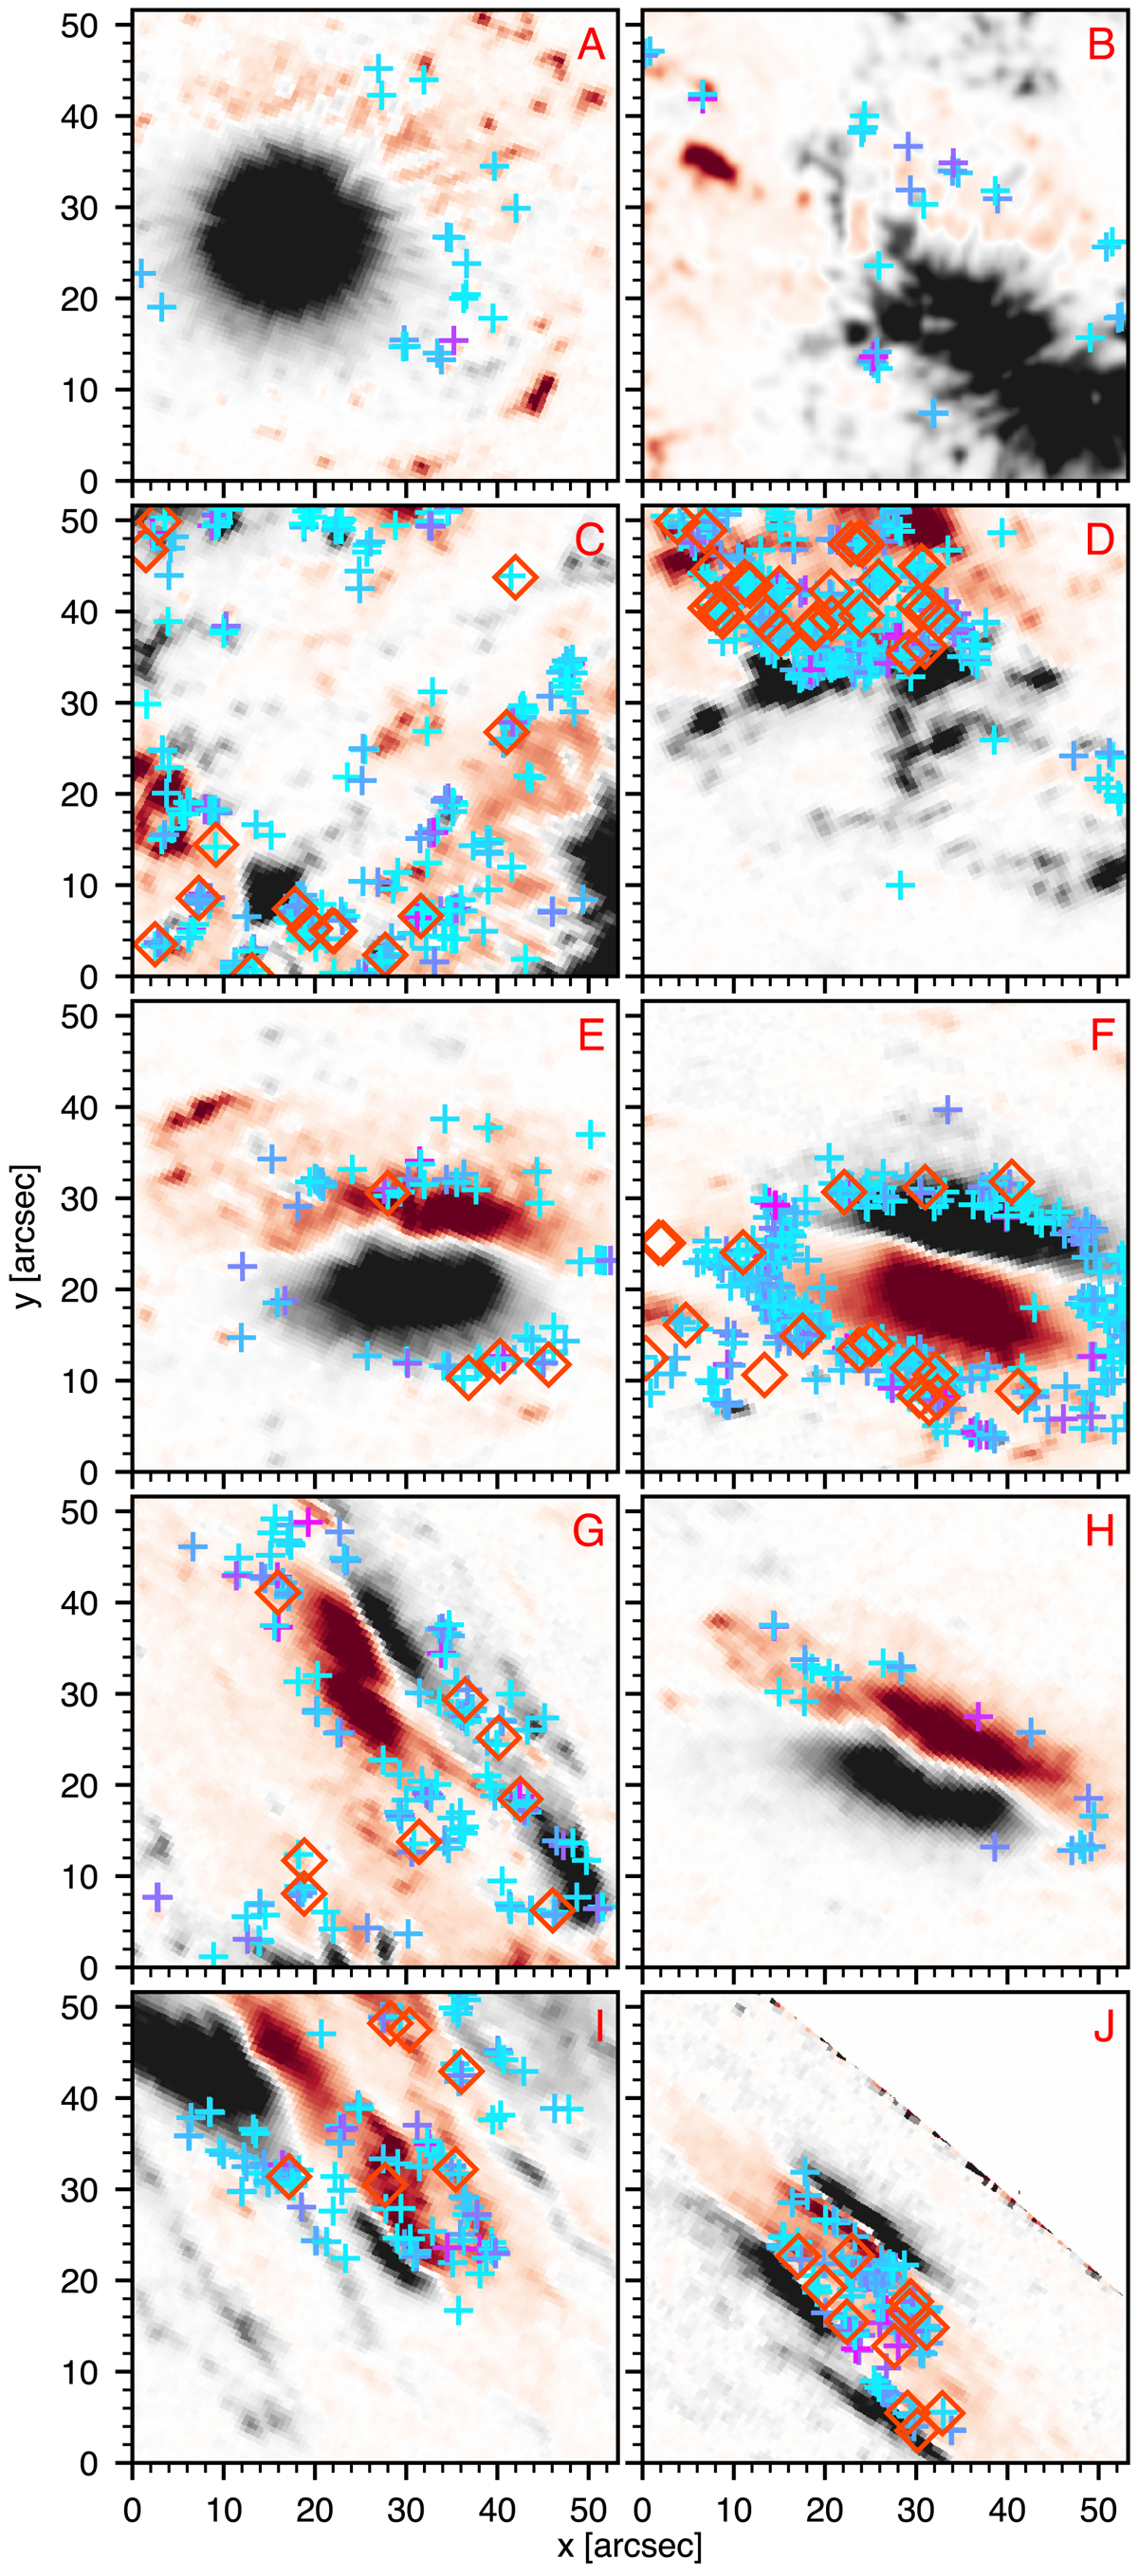
Spatial distribution of all Hα Ellerman bomb detections (coloured crosses) for each data set (labelled in the top right of each panel) overlaid on HMI line-of-sight magnetograms, with positive (negative) polarity in red (black) and zero field strength in white. The cross colour is indicative of the event lifetime, ranging from cyan to purple for lifetimes between 0 and 15 min, with orange open diamonds for longer-lived events. The field-of-view in panel D is slightly shifted with respect to Fig. 1 to show all Hα detections and that the off-limb part of panel J has been manually set to zero. The magnetogram scales were byte-scaled independently.
Current usage metrics show cumulative count of Article Views (full-text article views including HTML views, PDF and ePub downloads, according to the available data) and Abstracts Views on Vision4Press platform.
Data correspond to usage on the plateform after 2015. The current usage metrics is available 48-96 hours after online publication and is updated daily on week days.
Initial download of the metrics may take a while.