Fig. 4.
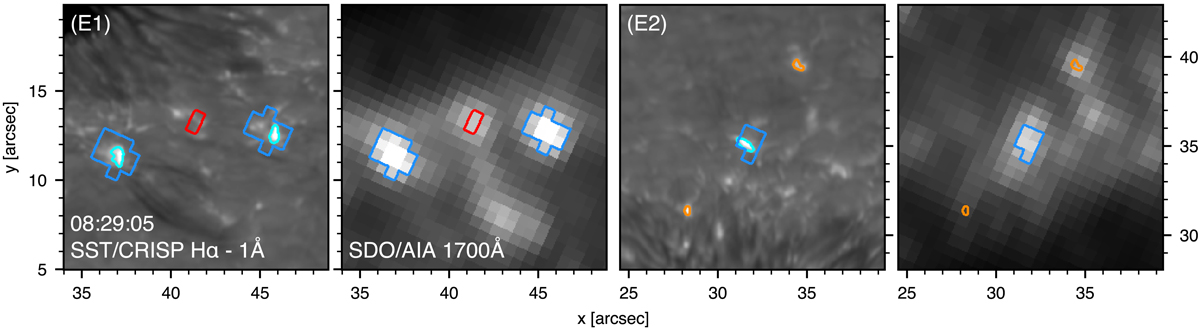
Examples of detection evaluations from data set E. The two panel pairs show Hα−(0.9–1.1) Å blue-wing average intensity and AIA 1700 Å intensity for the similarly numbered cutouts in panel pair E of Fig. 1. Detection contours in Hα (cyan and orange) and AIA 1700 Å (blue and red; 5σ threshold, minimum of 1 AIA px and 2 frames visibility) are overlaid. The blue AIA contours (all panels) are classified as true positive (TP) detections from their degree of overlap with the cyan Hα contours (first and third panel), whereas the red contour in the first panel pair shows a false positive (FP), the orange contours in the second panel pair two false negatives (FN).
Current usage metrics show cumulative count of Article Views (full-text article views including HTML views, PDF and ePub downloads, according to the available data) and Abstracts Views on Vision4Press platform.
Data correspond to usage on the plateform after 2015. The current usage metrics is available 48-96 hours after online publication and is updated daily on week days.
Initial download of the metrics may take a while.