Fig. 11.
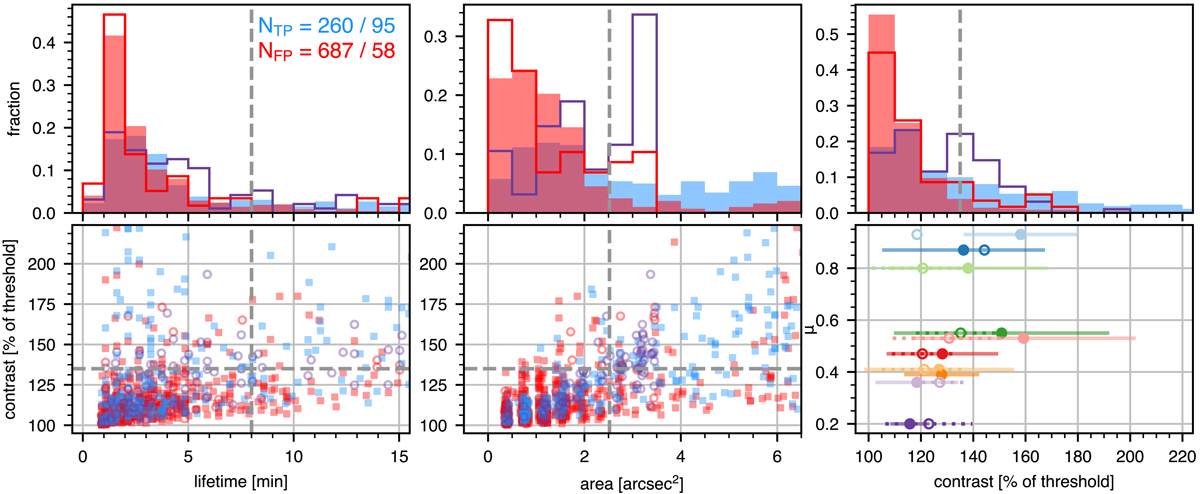
AIA 1700 Å detection statistics as function of properties. Figure layout as for Fig. 5, except that in all but the last panel distinction is made between true positives TP (AIA detection with Hα detection) and false positives FP (AIA detection without Hα detection) rather than data sets. The peak contrasts are given as percentage above the intensity threshold (quiet-Sun average +5σ for F1 maximisation, +9σ for P maximisation). Upper row: each panel shows the TP (blue and purple) and FP (red) distribution distributions for the parameter combination maximising F1 (filled histograms) and P (outlined histograms). Lower row: as Fig. 5 but the symbols in the two scatter plots are colour-coded between TP and FP as in the upper row, and with distinction between F1 maximisation (filled circles) and P maximisation (open circles). The last panel shows average peak contrasts for the TP detections with the bar lengths showing the rms spreads around the indicated mean values and with similar distinction between maximising F1 (filled circles and solid lines) and maximising P (open circles and dotted lines). The total TP and FP numbers are given in the top right of the first panel, with slash-separation between F1 and P maximisation. The vertical and horizontal dashed grey lines in all but the last panel indicate the threshold values for sub-selection of the top 10% longest-lived, largest and brightest events.
Current usage metrics show cumulative count of Article Views (full-text article views including HTML views, PDF and ePub downloads, according to the available data) and Abstracts Views on Vision4Press platform.
Data correspond to usage on the plateform after 2015. The current usage metrics is available 48-96 hours after online publication and is updated daily on week days.
Initial download of the metrics may take a while.