Fig. 1.
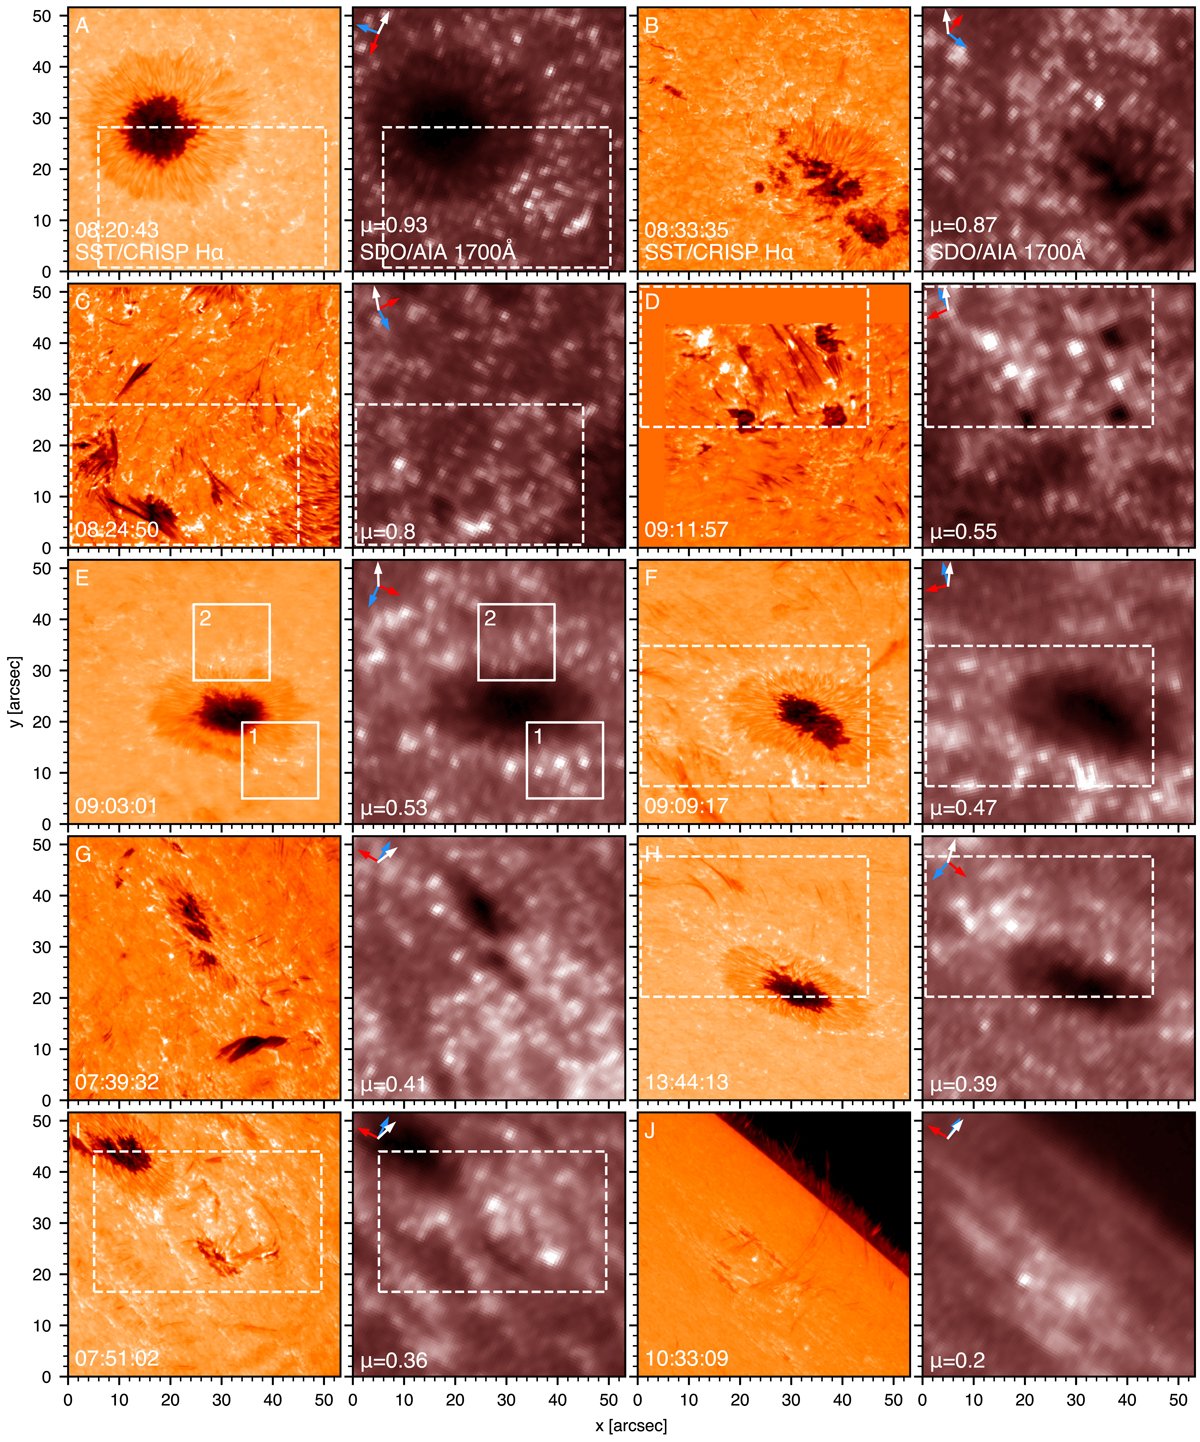
Full field-of-view samples of all 10 data sets. Panel pairs (A)–(J) show near-simultaneous co-aligned CRISP Hα-wing images (orange; blue-wing images averaged around −1 Å for all but data set B that shows the red wing at +1 Å) and AIA 1700 Å images (red-brown), ordered by decreasing viewing angle μ (= cos θ, with θ the angle between the line-of-sight and the normal to the solar surface) specified at lower-left in each AIA panel with the image-centre solar (X, Y) location. The times of the SST observations are specified at lower-left in each CRISP panel. The corresponding AIA image cutouts were interpolated to these from their 24 s sampling cadence (through nearest-neighbour frame selection) and rotated to the SST orientation. Each field of view has been cut slightly to obtain the same display size and scale. The arrows at top left in each AIA panel point towards solar north (red), west (blue) and the nearest limb (white). Each image is byte-scaled independently including high-level clipping to improve the overall scene visibility. Dashed frames in pairs C, D, F and I define cutouts for Fig. 2, solid frames in pair E define cutouts for Fig. 4.
Current usage metrics show cumulative count of Article Views (full-text article views including HTML views, PDF and ePub downloads, according to the available data) and Abstracts Views on Vision4Press platform.
Data correspond to usage on the plateform after 2015. The current usage metrics is available 48-96 hours after online publication and is updated daily on week days.
Initial download of the metrics may take a while.