Fig. 7.
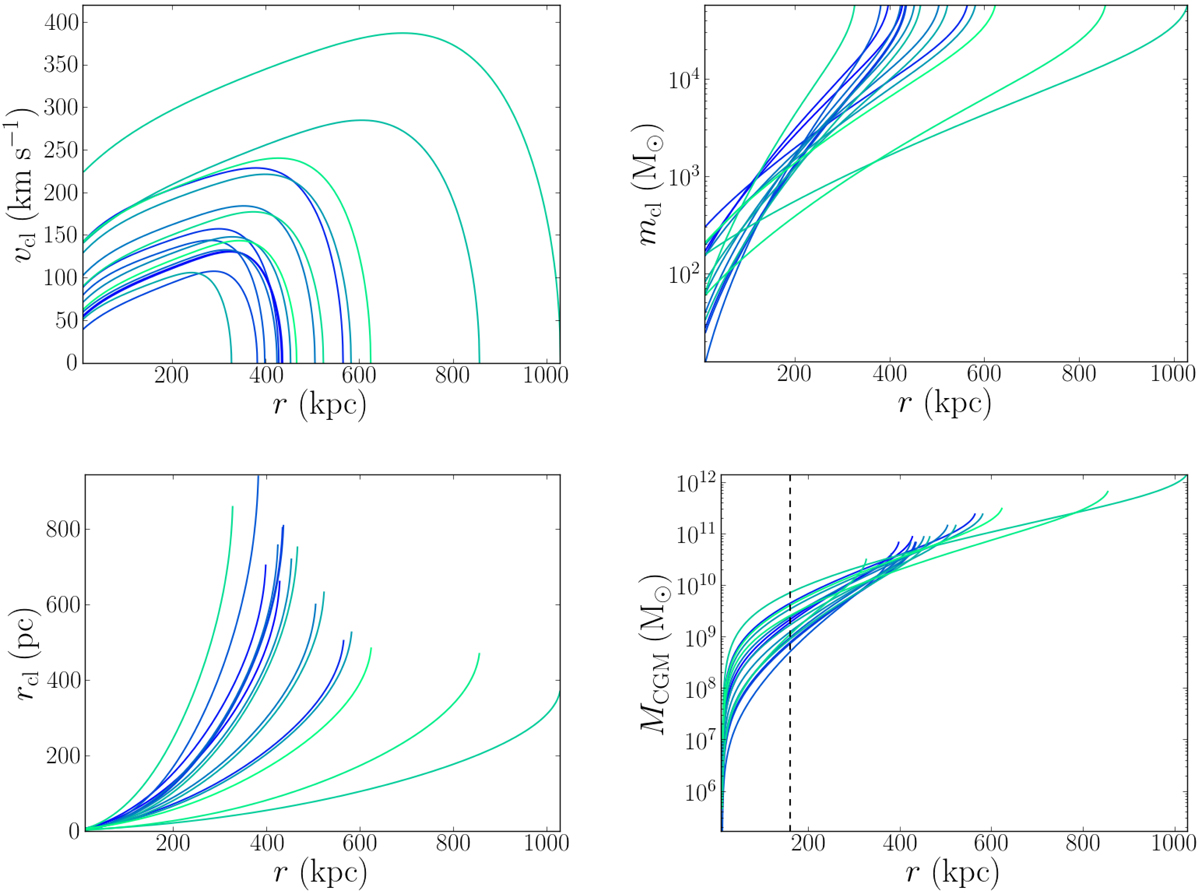
Properties of the cool CGM clouds described by our best model. All the profiles are plotted with respect to the intrinsic distance from the central galaxies and the different colored lines represent the result for the sixteen different galaxies of the sample. Top left: velocity profiles of the cool clouds. Top right and bottom left: respectively masses and radii of the cool clouds. Bottom right: cool CGM cumulative mass profile, with the vertical dashed line representing the distance of 160 kpc.
Current usage metrics show cumulative count of Article Views (full-text article views including HTML views, PDF and ePub downloads, according to the available data) and Abstracts Views on Vision4Press platform.
Data correspond to usage on the plateform after 2015. The current usage metrics is available 48-96 hours after online publication and is updated daily on week days.
Initial download of the metrics may take a while.