Fig. 6.
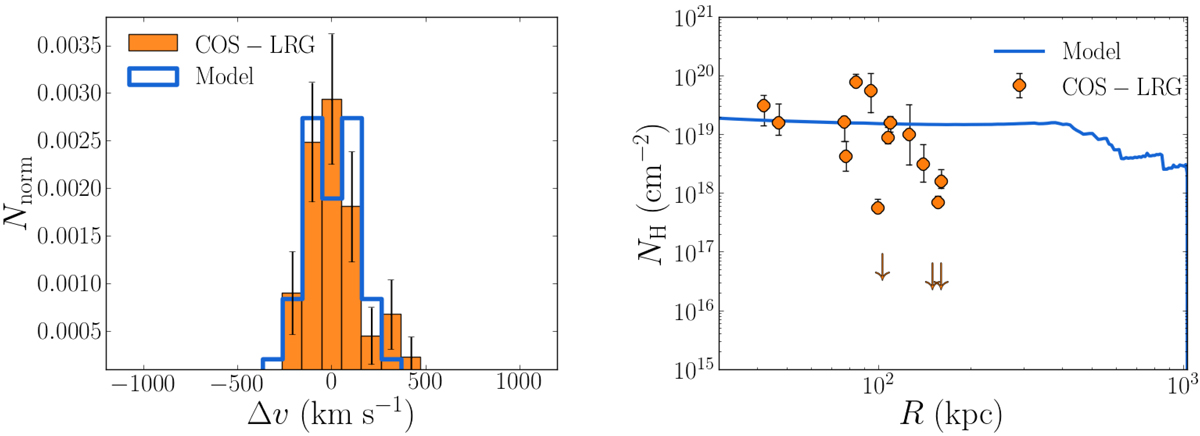
Comparison between the observations (orange bars and circles) and our best model results (blue lines). Left panel: normalized line-of-sight velocity distribution, where the errors in the observations are obtained with the bootstrapping method. Right panel: total hydrogen column density. The downward arrows represent the upper limits of the non-detections.
Current usage metrics show cumulative count of Article Views (full-text article views including HTML views, PDF and ePub downloads, according to the available data) and Abstracts Views on Vision4Press platform.
Data correspond to usage on the plateform after 2015. The current usage metrics is available 48-96 hours after online publication and is updated daily on week days.
Initial download of the metrics may take a while.